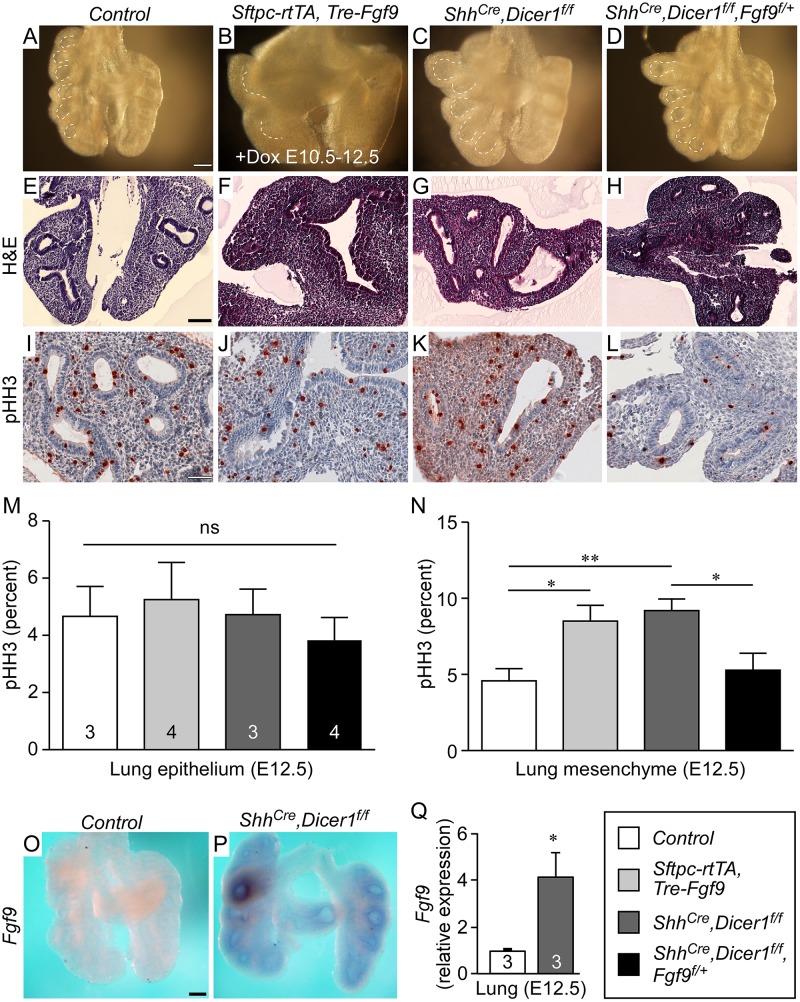
Fig 1. Dicer1 regulation of lung epithelial development requires Fgf9.
(A-D) Comparison of E12.5 whole mount lung morphology of Control (A), Sftpc-rtTA, Tre-Fgf9-Ires-eGfp lungs induced with doxycycline from E10.5-E12.5 (B), Shh Cre/+, Dicer1 f/f (C) and Shh Cre/+, Dicer1 f/f, Fgf9 f/+ (D). (E-H) H&E stained histological sections of the lungs shown above in panels A-D. (I-L) Representative immunostaining for phospho-histone H3 (pHH3) of the lungs shown in panels A-D. (M and N) Quantification of epithelial (M) and mesenchymal (N) cell proliferation of pHH3 labeled lung tissue in Control; Sftpc-rtTA, Tre-Fgf9-Ires-eGfp lungs induced with doxycycline from E10.5-E12.5; Shh Cre/+, Dicer1 f/f lungs; and Shh Cre/+, Dicer1 f/f, Fgf9 f/+ lungs. For each group, at least 3 individual samples were included, 3 different slides were chosen from each sample, and for each section, three 10x fields were counted for the number of positive cells per 100 cells. (O and P) Whole mount in situ hybridization showing increased expression of Fgf9 in E12.5 Shh Cre/+, Dicer1 f/f lung epithelium (P) compared to control lung (O). (Q) Quantitative RT-PCR showing increased expression of Fgf9 in E12.5 Shh Cre/+, Dicer1 f/f lung (n = 3) epithelium compared to control lung (n = 3). *P<0.05; **P<0.01; ns, not significant. Scale bars: A, 200 μm; E, 100 μm; I, 50 μm; O, 200 μm. Sample numbers (n) are indicated in data bars.

