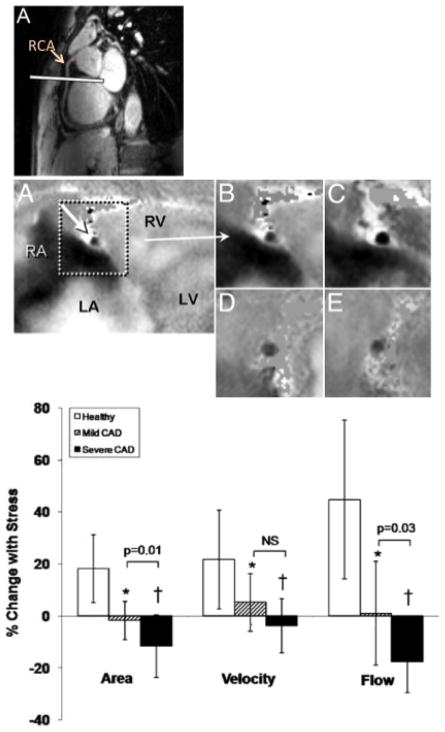
Figure 2.
Noninvasive detection of coronary endothelial dysfunction and regional differences in coronary endothelial function. (Upper Panel) “White blood” scout MRI of the right coronary artery (RCA) in long axis with white line representing orientation of subsequent cross-sectional images shown in middle panel. (Middle Panel) Flow velocity-encoded MRI phase images showing a cross section of the RCA (A) that was selected for analysis for coronary flow velocity measurements in a healthy volunteer. The signal intensity is proportional to flow velocity, with a black signal indicating high velocity down through the imaging plane. In the magnified view of the RCA at baseline (B) and during isometric handgrip stress (C), the decrease in luminal coronary signal intensity (increased blackness) illustrates an increase in through-plane coronary flow velocity. The cross section of the RCA in a coronary artery disease patient at rest (D) and during handgrip stress (E) indicates no increase in through-plane coronary flow velocity during stress. (Bottom Panel) Summary data showing relative change in coronary artery area, peak diastolic coronary flow velocity and blood flow during isometric handgrip stress for healthy subjects (n = 20 [open bars]) and patients with single-vessel coronary artery disease (CAD) (n = 10). Brackets show comparisons between arteries with mild CAD (hatched bars) versus severe CAD (solid bars) within the same patients. *p < 0.005, †p < 0.001 versus healthy subjects. Reproduced with permission from Hays et al (Hays et al. 2010)

