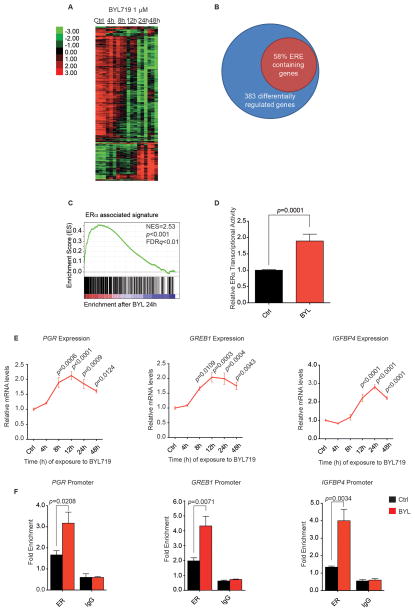
Figure 1. PI3K inhibition promotes ER function.
A) MCF7 cells were treated with BYL719 1 μM over a period of 48 hours. RNA was isolated at specified time points and expression microarray analysis performed. Heat map represents genes whose expression differed significantly across different time points with a FDR ≤ 1%. Each of the columns under the experimental conditions represents one biological replicate. B) PI3Kα inhibition leads to modulation of genes containing ER binding sites (ERE). MCF7 cells were treated with BYL719 1 μM, and gene expression analysis was performed as described in A. The diagram represents the genes that were differentially regulated upon treatment across all the time points (SAM analysis FDR ≤ 1%) and the percentage of these genes that contained an ER-binding element (defined by ER ChIP-sequencing (42)). C) GSEA analysis was performed to determine which gene sets were enriched in our data set (FDR ≤ 25%). Graph represents enrichment for ER-associated signature as described in (43). D) MCF7 cells were transfected with firefly- 3X ERE TATA luc and pRL-TK Renilla plasmids, and treated with vehicle (Ctrl) or BYL719 1 μM for 16 hours. Results represent firefly-luciferase activity measured by luminescence and normalized both to renilla-luciferase luminescence for transfection efficiency and to Ctrl. Two-tailed Student’s unpaired t test was performed to compare Ctrl vs BYL-treated cells. E) MCF7 cells were treated with BYL719 1 μM over a period of 48 hours, and RNA was isolated at the indicated times. qPCR was performed to detect βACTIN, PGR, GREB1, and IGFBP4 gene expression. The data are presented relative to βACTIN and to expression in vehicle-treated cells (Ctrl). One-way ANOVA statistical test was used to compare gene expression between each time point and vehicle-treated cells, applying the Bonferroni method to correct for multiple comparisons. Error bars denote the SEM of at least two biological replicates, each with three technical replicates. F) MCF7 cells were treated with BYL719 1 μM (BYL) or vehicle (Ctrl), and ChIP was performed with anti-ERα antibody or control IgG. Primers to amplify the ER-binding regions of the PGR, GREB1, and IGFBP4 promoters were used in qPCR to determine fold enrichment relative to a noncoding region. Two-tailed Student’s unpaired t test was performed to compare Ctrl vs. BYL-treated cells. Error bars represent the standard error of the mean (SEM) of three independent experiments.

