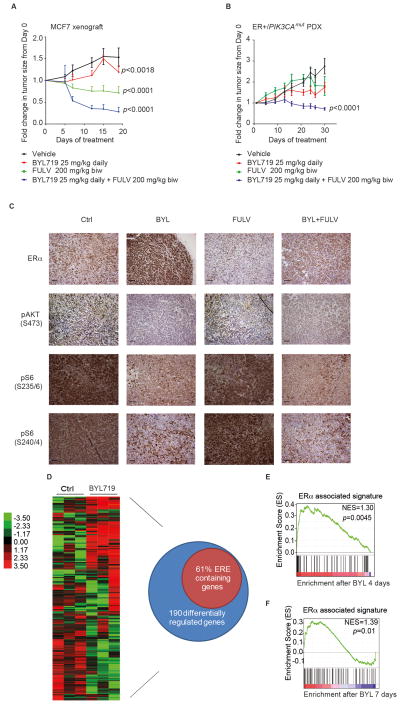
Figure 4. Combination of BYL719 and fulvestrant in vivo induces prolonged responses.
A) MCF7 in vivo xenograft was treated with vehicle, BYL719, fulvestrant, or the combination at the indicated doses and schedule. Graph shows the fold change in tumor volume with respect to day 0 of treatment. One-way ANOVA statistical test was performed to compare tumor volume fold change on the last day of treatment between each treatment arm and vehicle, applying the Bonferroni method to correct for multiple comparisons. Error bars represent standard error of the mean (SEM). B) ER-positive/PIK3CAmut patient-derived xenograft (PDX) bearing mice were randomized to receive treatment with indicated doses and schedules of vehicle, BYL719, and/or fulvestrant. Graph shows the fold change in tumor volume with respect to day 0 of treatment. One-way ANOVA statistical test was performed to compare tumor volume fold change on the last day of treatment between each treatment arm and vehicle, applying the Bonferroni method to correct for multiple comparisons. Error bars represent SEM. C) Pharmacodynamic study of MCF7 mouse xenograft. Mice were treated with vehicle, BYL719, fulvestrant, or the combination with the same dosing and schedule as in (A) for 4 days. Animals were sacrificed two hours after the last dose, and tumors processed for immunohistochemistry (IHC) and stained with the indicated antibodies. The figure shows representative images for each of the treatment arms. Scale bars 50 μm. D) A parallel pharmacodynamic study was performed with the ER-positive/PIK3CAmut PDX mice, which were treated with either vehicle or BYL719 with the same dosing and schedule as described in (B). Mice were sacrificed and tumors obtained on day 4, 2 hours after the last dose, and processed to obtain RNA for microarray gene expression analysis. Graph represents genes whose expression differed significantly across different treatments with a FDR ≤ 1%. Each of the columns under the experimental conditions represents one biological replicate. Venn diagram represents differentially regulated genes upon treatment with BYL719 (SAM analysis FDR ≤ 1%) and the percentage of these that contained an ER binding site, defined by ER ChIP-sequencing data available from (42). E) GSEA analysis was performed to determine which gene sets were enriched in the PDX microarray expression data set obtained in (D).Graph represents enrichment for ER-associated signature (FDR ≤ 25%) as described in (44). F) Pharmacodynamic studies on the MCF7 xenografts from (A) were performed on day 7 of treatment, by means of a punch biopsy in both vehicle and BYL-treated mice. A representative number of biopsies (at least two biological replicates per condition) was processed to obtain RNA and submitted for gene expression analysis. GSEA analysis was performed to determine which gene sets were enriched in our data set (FDR ≤ 25%). Graph represents enrichment for ER associated signature as described in (44). Vehicle (Ctrl); BYL719 (BYL); fulvestrant (FULV); combination (BYL+FULV).

