
Figure 4. HBD3 forms complexes with CpG and enhances CpG induced IFN-α.
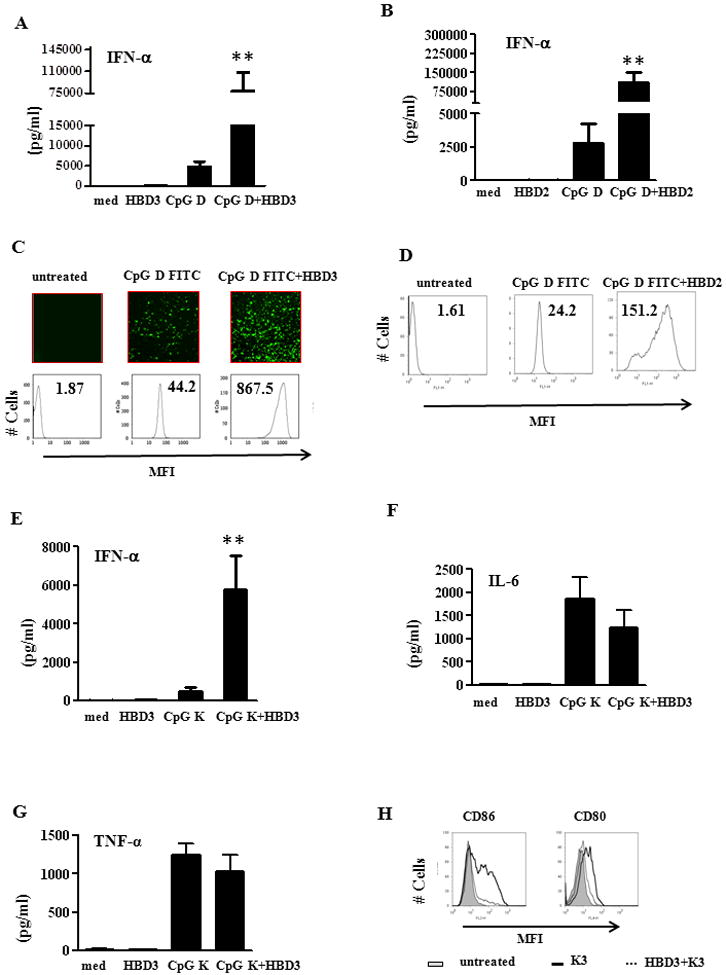
(A) HBD3 (2μM) or CpG ODN D mix was added to pDC cultures either alone or after complex formation. IFN alpha levels were measured after 24 hrs. One representative experiment out of six is shown. Error bars indicate SEM. (statistical significance was measured using student t test). (B) IFN-α levels from pDCs treated with either HBD2 or CpG D alone or after complex formation. One representative experiment out of five is shown (C) CpG ODN D35 labeled with FITC (1μM) was mixed with HBD3 (2μM) for 30 minutes at RT and added to pDC cultures. Cells were analyzed by light microscopy and FACS for internalization. One representative experiment out of five is shown (D) FITC labeled CpG (1μM) was mixed with HBD2 (2 μM) for 30 min at RT and added to pDCs. Cells were analyzed by FACS after 30 minutes. One representative experiment out of five is shown. CpG K3 (1μM) was complexed with HBD3 (2μM) for 30 min and added to pDCs cultures. After 24 hrs supernatants were measured for (E) IFN-α (F) IL-6 and (G) TNF-α. (H) CpG K3 (1μM) was complexed with HBD3 (2μM) and added to pDCs cultures. Cells were analyzed by FACS for CD86 and CD80 respectively after 24 hrs. One representative experiment out of three is shown Error bars indicate SEM. (statistical significance was measured using student t test). * P<0.05, ** P <0.001