
Figure 6. Isothermal titration calorimetry (ITC) experiment with DNA CpG ODN35 binding to protein HBD3.
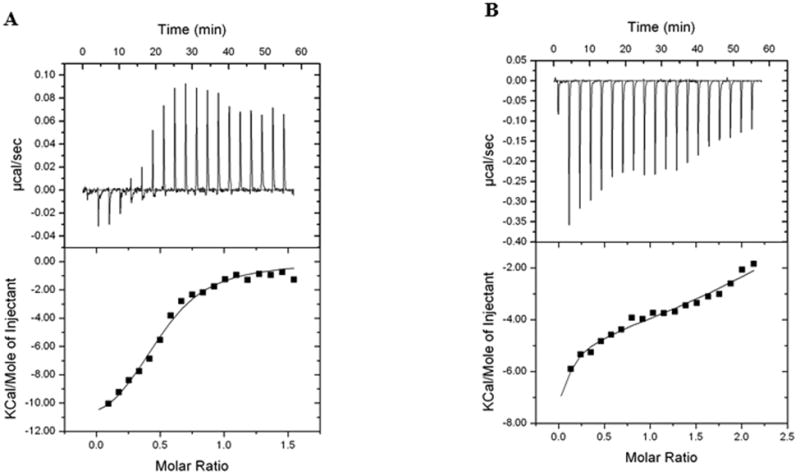
The exothermic binding isotherm (above) was integrated to give the enthalpy change plotted as a function of the molar ratio of DNA/protein (panel A) or protein/DNA (Panel B). The integrated enthalpy change data were used to calculate the binding affinity. One representative experiment out of two is shown.