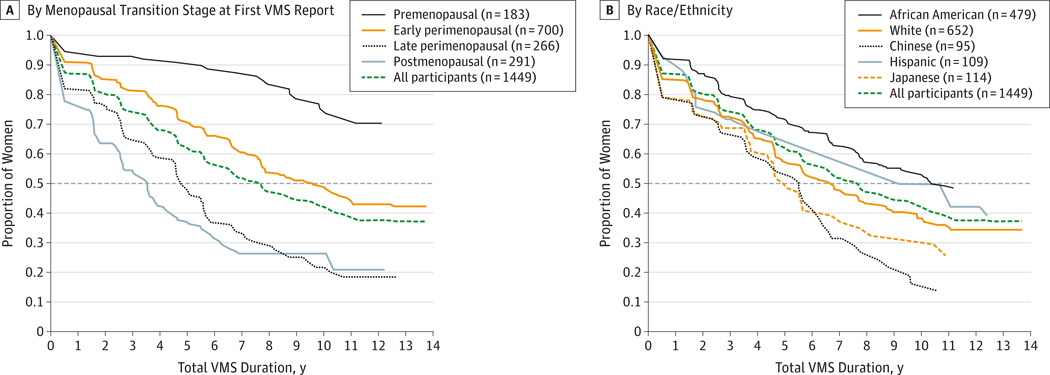
Figure 2. Kaplan-Meier Estimates of Total VMS Duration of Frequent VMS by Menopausal Transition Stage at First VMS Report (A) and by Race/Ethnicity (B).
A, By menopausal transition stage at first VMS report. B, By race/ethnicity. VMS indicates vasomotor symptoms. Menopausal transition stage at first VMS report is missing for 9 participants. Median duration for each group is calculated as the value on the x-axis corresponding to the intersection of the dashed horizontal line (50%) with the group’s survival curve.

