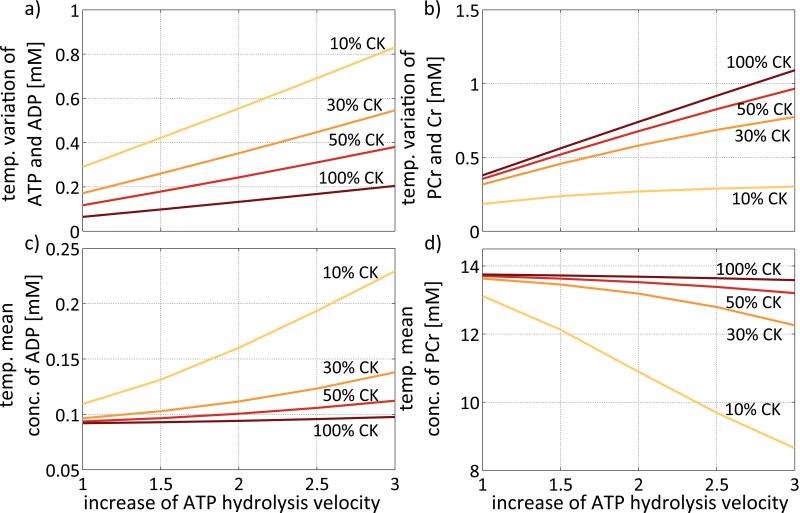
Figure 6.
Variations during the cardiac cycle and temporal mean values of HEPs dependent on CK activity and ATP hydrolysis velocity at a constant heart rate of 60min−1. While variations in the ATP and ADP pools are increased with decreasing CK activity and increasing ATP hydrolysis (a), variations in the PCr and Cr pools are increased with increasing CK activity and increasing ATP hydrolysis velocity (b). Similarly, while ADP concentration increases with decreasing CK activity and increasing ATP hydrolysis velocity (c), PCr concentration increases with decreasing CK activity and increasing ATP hydrolysis velocity (d). In this model changes in ATP hydrolysis velocity are accompanied by proportional changes in maximum ATP synthesis velocity from ADP and Pi to provide equilibrium between ATP production and consumption.

