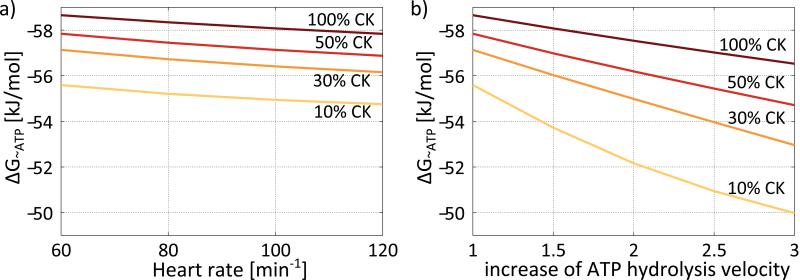
Figure 7.
Free energy of ATP hydrolysis, ΔG~ATP, at systole for 100%, 50%, 30% and 10% CK activity dependent on heart rate (a) and increase of ATP hydrolysis (b). The energy available from ΔG~ATP is highest for 100% CK activity and decreases slightly with increasing heart rate (a). The decrease of the energy available from ΔG~ATP with increased of ATP hydrolysis is more pronounced compared to that with heart rate and stronger with decreasing CK activity (b).

