
Figure 1. The cell growth and division cycle.
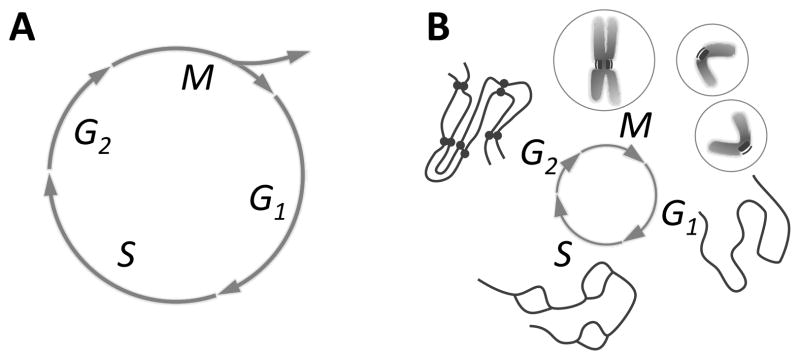
Fig. 1A: Mitosis (M) is seen in the context of the whole cell cycle, represented as a circle. “Interphase”, the time between divisions, includes S phase, when the cell’s DNA is replicated, and gaps (G1 and G2) before and after S phase. M is followed by cell division, or “cytokinesis”, which divides the already duplicated cell into two essentially identical pieces. The timing of cytokinesis relative to mitosis and interphase varies among different cells, so it is shown only as the forking arrows that imply the emergence of two cells from one. Fig. 1B: Chromosome structure as a function of time in the cell cycle: in G1 one de-condensed chromosome is shown, representing all chromosomes in the cell. These are replicated during S (“bubbles” are places where replication has already occurred, but replication is not yet complete). In G2 there are two copies of each chromosome, still held together by cohesions (bars between “chromatids” in the diagram). In early M (prophase) the chromosomes condense, whereupon one can see each chromosome as a double object with two chromatids and a primary constriction (centromere) where cohesions still hold the chromatids together. This is the site where kinetochores form. During M the chromatids separate; in cytokinesis a cell is formed around each chromosome set. Circles on either side of M represent first the one, then the two cells formed by division.