
Fig 3. Microscopic analysis of GAS.
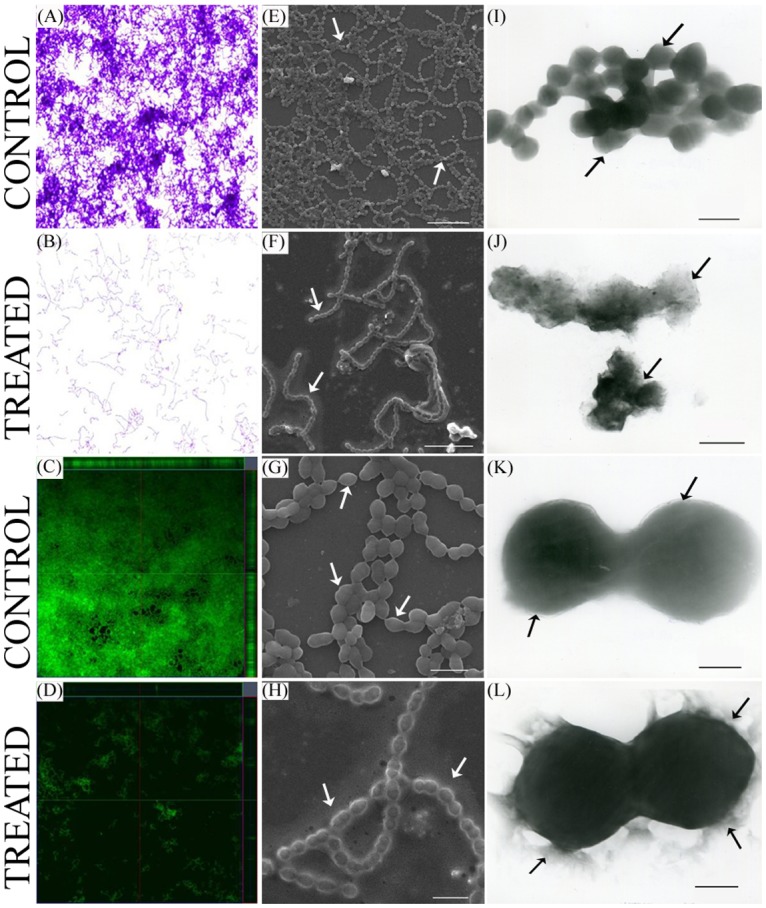
Microscopic images of GAS grown over glass slides (1 x 1 cm) in THYG in the presence and absence of 3FCA at 132μg/ml concentration. (A, B) Light microscopic images (at 400X) of crystal violet stained GAS biofilm grown in the presence of 3FCA (B) and in presence of vehicle control (A). (C, D) CLSM images of acridine orange stained group A streptococcal biofilm grown in the presence (D) and absence (C) of 3FCA. Both the light microscopic and CLSM images clearly display the antibiofilm activity of 3FCA. (E, F, G, H) SEM images of GAS biofilm. (E and F) showing the breach in streptococcal biofilm grown in the presence of 3FCA. Scale-10 μm. (G and H) Displaying the difference in the morphology of GAS grown in the presence (H) and absence of 3FCA (G). Scale-2 μm. (I, J, K, L) TEM images displaying the increased extracellular hyaluronic acid secretion around 3FCA treated GAS (J, L) compared to corresponding control (I, K). [I, J Scale-1 μm, K, L scale-250 nm]. Significant differences in control and treated samples are highlighted with arrows.