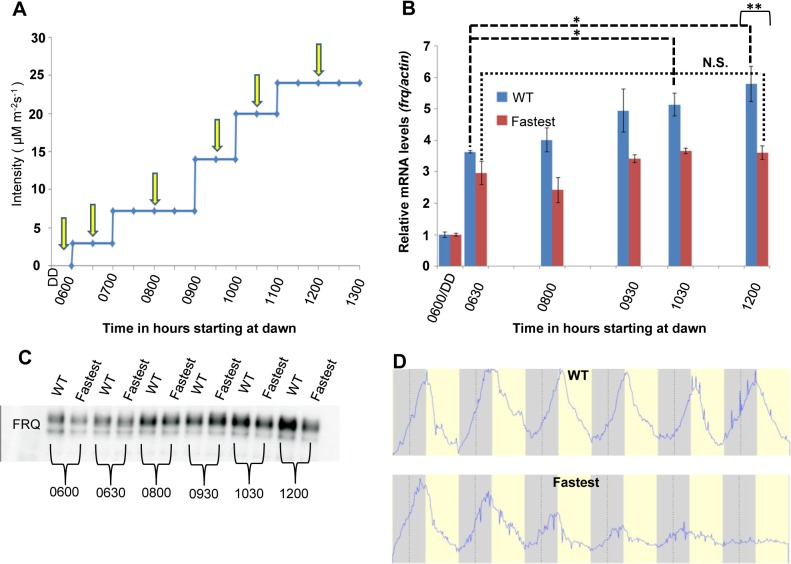
Fig 5. The WT strain increases frq transcription in response to increasing light intensity whereas the fastest photocycle mutant does not and exhibits marked circadian defects in quasi-normal LD cycles.
(A) Experimental design to examine frq mRNA and FRQ protein levels in response to increases in light. Yellow arrows indicate times of harvest. Blue light intensity was increased using an externally controlled LED incubator to mimic increasing blue light intensity during the first half of a daily light cycle. (B) frq mRNA levels (n = 3 for each strain) in WT(blue) and fastest photocycle mutant strain (red) was determined using RT-PCR at time points shown in panel (A). (C) Western blot showing FRQ protein levels in the WT and fastest photocycle mutant strain at time points corresponding to panel (A). (D) Averaged densitometric traces of race tubes for WT (n = 2) and the fastest photocycle mutant (n = 4) grown under quasi-normal 12 hour light: 12 hour dark (LD) cycles with maximum light intensity limited to ~10 μM m-2s-1. Asterisks indicate statistical significance as determined by an unpaired t test. ***P<0.001, **P<0.01, *P<0.05, N.S. difference not significant.

