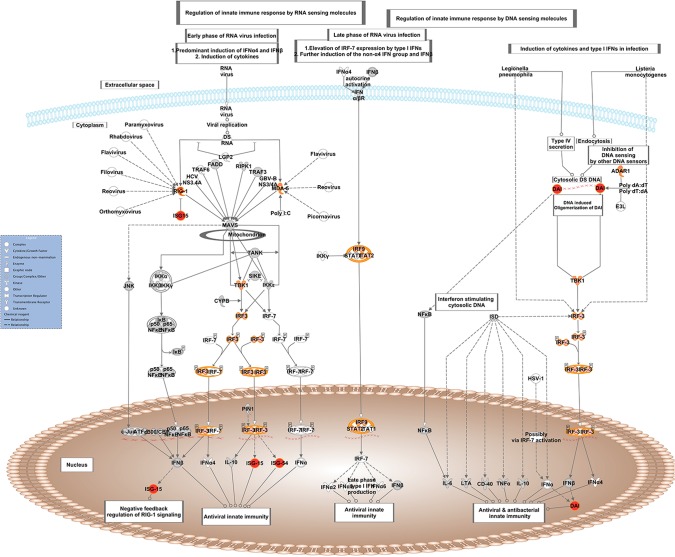
Fig 3. Schematic representation of the Activation of IRF by Cytosolic Pattern Recognition Receptors pathway from IPA.
Genes within the pathway showing differential expression are highlighted in colour. The colour intensity indicates the degree of elevated expression in Suffolk (red) or in Texel (green). Grey shading indicates genes that were not differentially expressed; white shading represents genes in the pathway not represented on the RNA-seq data.

