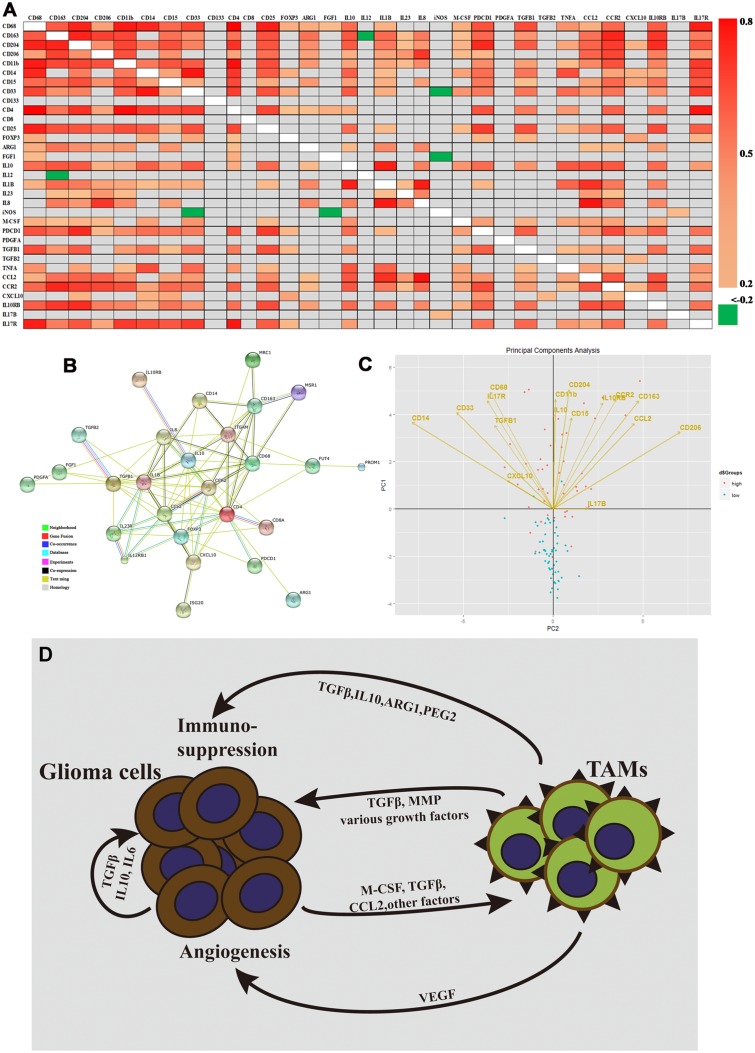
Fig 4. Expression patterns of cell markers and immunomodulatory genes, and Model of M2 microglia/macrophage production in GBM.
(A) Heat map representation of statistically significant differentially expressed genes (P<0.05). Spearman correlation was performed between the expression levels of the indicated gene pairs in the cohort (Spearman coefficients are shown as colors corresponding to the scale bar). Gray represents gene combinations without significant correlation. (B) Protein interaction subnetwork based on protein-coding genes and their interacting partners. Nodes represent protein coding genes; links represent physical interactions. Nodes in color indicate enriched biological functions of the proteins. A red line is indicative of fusion; green line—neighborhood evidence; blue line—co-occurrence evidence; purple line—experimental evidence; yellow line—text mining evidence; light blue line—database evidence; black line—co-expression evidence. mRNA expression of genes from (C) were used for PCA analysis, which is represented by 2-dimensional visualization. The symbols represent independent patient data (blue—low risk group; pink—high risk group). PCA projections of the first 2 principal components are shown. Arrows represent individual genes with the points directed at their loading coordinates. (D) Tumor-derived molecules, such as TGFβ and M-CSF, can polarize glioma-associated microglia/microphages (MMs) toward the M2 phenotype and stimulate the production of anti-inflammatory molecules. Other glioma-derived molecules, such as CCL2 and VEGF, can recruit myeloid cells into the tumor site. TAMs refer to tumor-associated microglia/macrophages.

