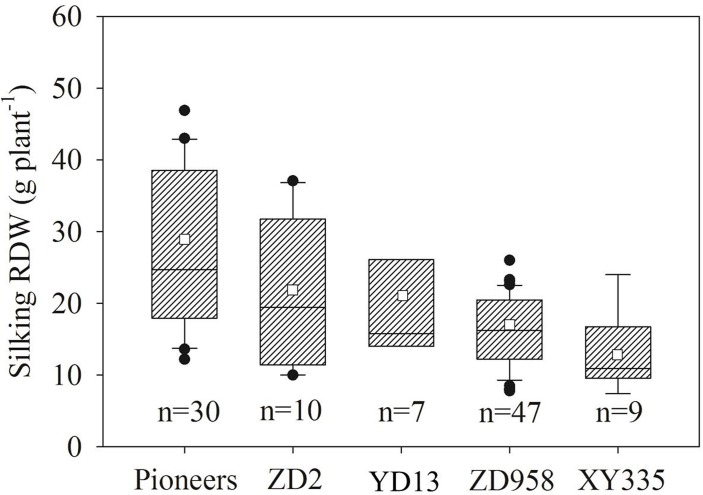
Fig 4. Comparisons of root dry weight at silking (silking RDW) between four dominant Chinese maize varieties and US pioneer variety.
The solid line and square within the box represents the median and mean values of all data, the top and bottom edges of the box represent 75 and 25 percentiles and the top and bottom bars represent 95 and 5 percentiles of all data, respectively.

