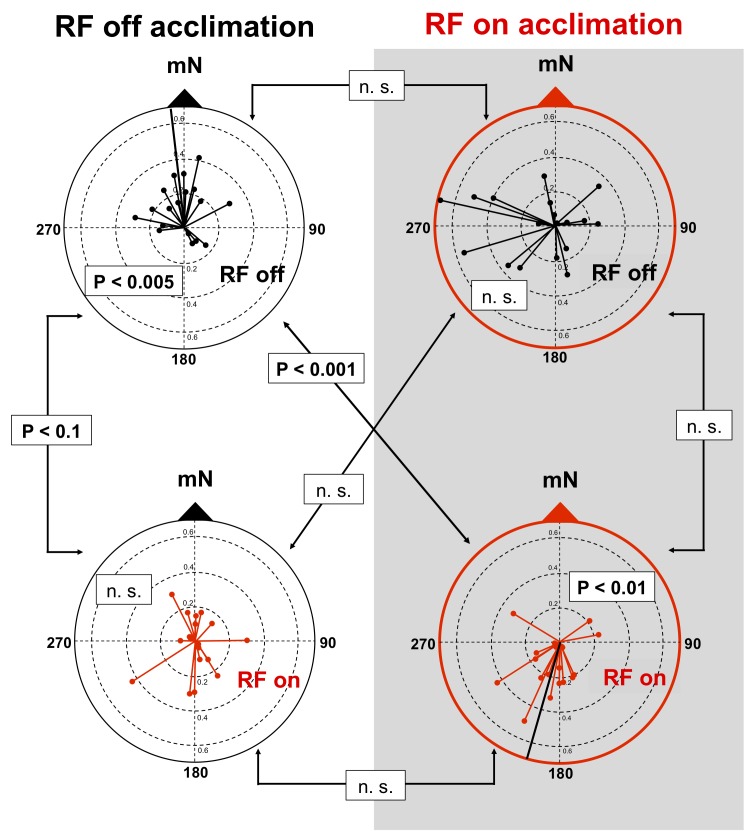
Fig 1. Magnetic component of responses of individual turtles plotted relative to magnetic North (mN).
Magnetic directional preferences of turtles combined from four magnetic field alignments (magnetic north aligned in each of the four cardinal directions). Responses of turtles initially exposed to the magnetic field without RF are shown in the left column with black outer circles. Responses of turtles initially exposed to the magnetic field in the presence of the RF stimulus are shown in the right column with red outer circles. Black lines connected to black dots (labeled “RF off”) are the mean vectors showing the magnetic component pooled from the four magnetic field alignments in which the turtles were tested without RF, and the responses shown in red (labeled “RF on”) are from the four magnetic fields alignments in which the same turtles were tested in the presence of RF. Moore’s modified Rayleigh test was used to test each distribution for non-random unimodal alignment. Dependent data, e.g., diagrams in the left column or in the right column with the same colored circles (showing data collected from the same individuals), were tested for significant differences using Moore’s paired sample test. Independent data (i.e. distributions in the same horizontal row obtained from different individuals) were tested for significant differences using the Mardia’s two-sample test.

