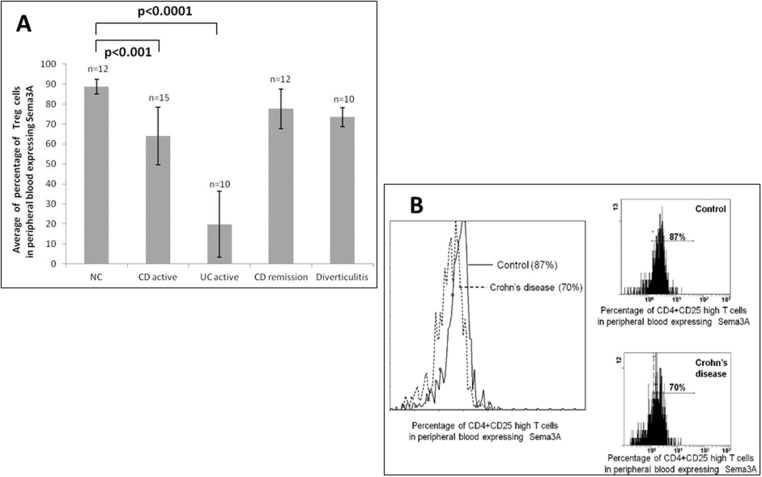
Fig 1.
A: The percentage of Treg cells expressing sema3A. The percentage of Treg cells expressing sema3A in peripheral blood in patients suffering from Crohn’s disease [both active (n = 15) or in remission (n = 12)], ulcerative colitis (active, n = 10), and from patients suffering from acute diverticulitis (n = 10) compared to that from healthy controls (n = 12). Note the significantly altered percentage of Treg cells expressing sema3A in all IBD patients when compared to that of normal individuals. B: A representative figure of Treg cell expressing sema3A. A representative FACS analysis of Treg cell expressing sema3A in a CD patient compared to that of normal individual.

