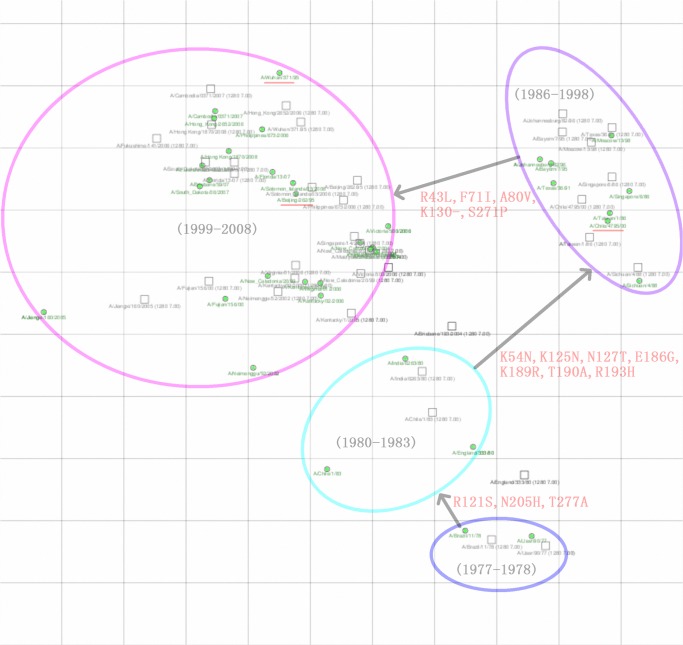
Fig 3. Antigenic map of human H1N1 seasonal influenza viruses from 1977 to 2008.
The relative positions of strains (green circles) and antisera (uncolored squares) are adjusted such that the distances between strains and antisera on the map represent the corresponding HI measurements with the least error. One unit (grid) corresponds to a two-fold dilution of antiserum in the HI assay. The cluster-transition amino acid substitutions are shown in red.

