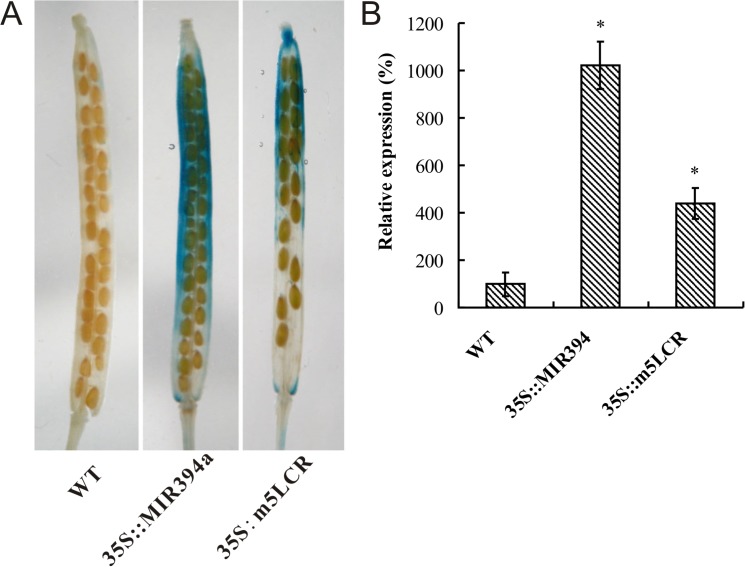
Fig 6. DR5-GUS expression in Arabidopsis wild type (Col), 35S::MIR394a and 35S::m5LCR fruits.
A: Visualization of DR5-GUS reporter in stage 17 fruits of pDR5::GUS/Col, pDR5::GUS/MIR394a and pDR5::GUS/m5LCR transgenic plants. B: Relative quantification of GUS intensity in stage 17 fruits of wild type (Col), 35S::MIR394a and 35S::m5LCR. The intensity of GUS coloration was statistically quantified using Adobe Photoshop CS software. Twenty fruits were measured. The relative intensity of WT is considered as 100%. Vertical bars represent the standard deviation of the mean treatments (n = 3). Asterisks indicate that mean values are significantly different between the 35S:MIR394a or 35S:m5LCR plants and WT (p < 0.05).

