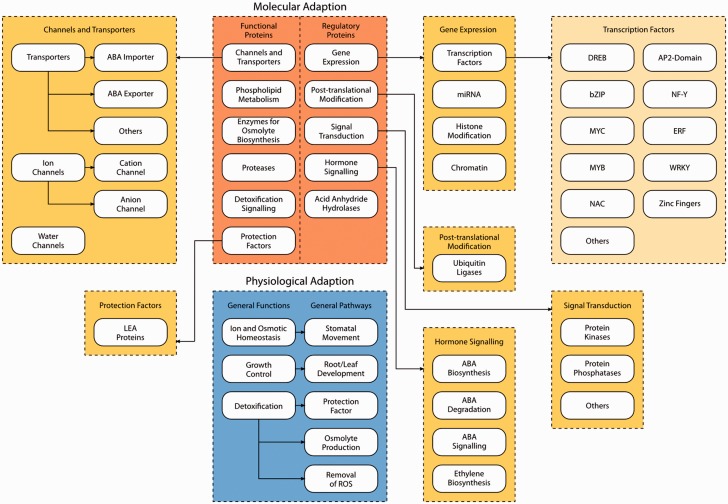
Figure 1.
Schematic overview of the three layers of DroughtDB. Layer 1 consists of the two blocks molecular adaptation (orange) and physiological adaptation (blue). Layer 2 (dark yellow) shows a more detailed categorization of the pathways of molecular adaptation (e.g. Gene Expression is grouped into transcription factors, miRNA, Histone Modification and Chromatin). Layer 3 (light yellow) represents specific gene families involved in drought stress response (e.g. transcription factors encoded by the DREB, bZIP, MYC, MYB, NAC, AP2-domain, NF-Y, ERF, WRKY and zinc finger gene family).

