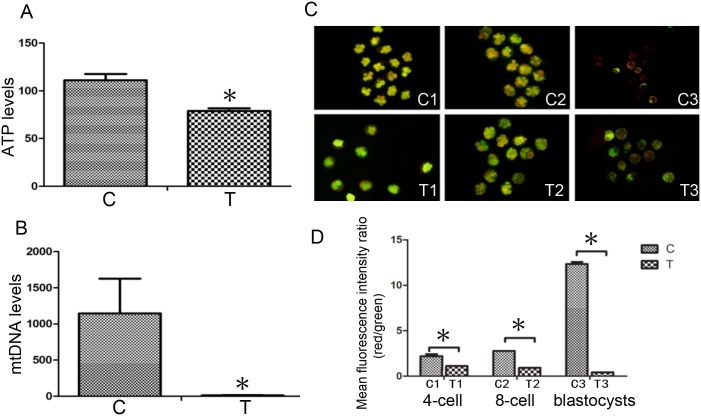
Fig 3.
A) The ATP content of the mouse blastocysts was detected via firefly luciferase analysis. B) The relative expression levels of mtDNA and cDNA. Values are presented as multiples of COXII DNA relative to the β-actin DNA. C) Mitochondrial membrane potential was assessed by JC-1. D) Statistical analyses of the red and green mean fluorescence intensity ratios revealed that the mitochondrial membrane potential of the T group was significantly reduced compared with the C group, *P<0.05. Data are means ± SD of 3 separate experiments.

