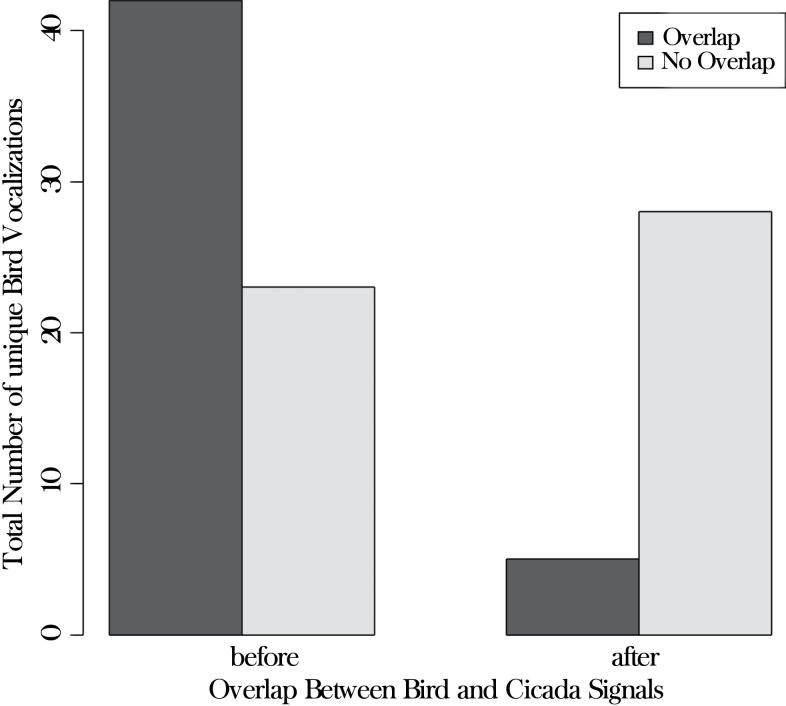
Figure 2.
Rate of overlap, excluding “complete” overlap, between bird and cicada signals before versus after the onset of cicada signaling for 7 recording days during June and July 2012 in secondary wet forest at Las Cruces Biological Station, Costa Rica. The “overlap before” bar represents the number of unique bird vocalizations produced prior to the onset of Zammara chorusing, with spectra that overlap to any degree with the normal base frequency range of Zammara signals. The “overlap after” bar represents the number of unique bird vocalizations with spectra that overlapped to any degree with the actual Zammara signals.

