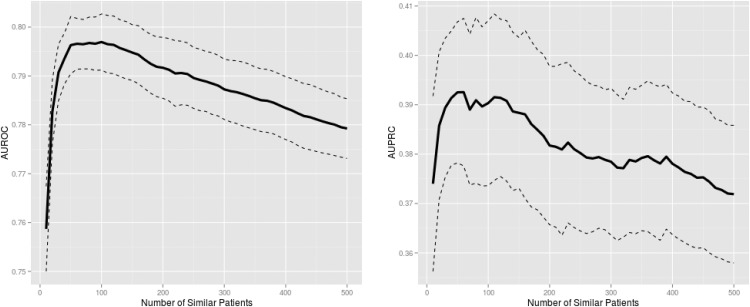
Fig 1. Mortality prediction performance of death counting among similar patients.
The solid and dashed lines are the mean and 95% confidence intervals, respectively, from 10-fold cross-validation. A trade-off between training data homogeneity and size is apparent; as the number of similar patients in the training data increases, predictive performance improves initially at a rapid rate thanks to increasing training data size but starts to degrade gradually due to decreasing homogeneity within the training data. AUROC: area under the receiver operating characteristic curve; AUPRC: area under the precision-recall curve.

