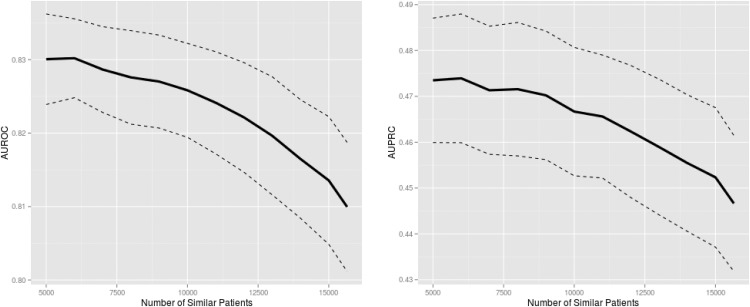
Fig 2. Mortality prediction performance of personalized logistic regression trained on similar patient data.
The solid and dashed lines are the mean and 95% confidence intervals, respectively, from 10-fold cross-validation. The maximum number of similar patients corresponds to all available training data. Predictive performance clearly improves as data from fewer but more similar patients are used for training. Identical predictor values in training data prohibited decreasing the number of similar patients further. AUROC: area under the receiver operating characteristic curve; AUPRC: area under the precision-recall curve.

