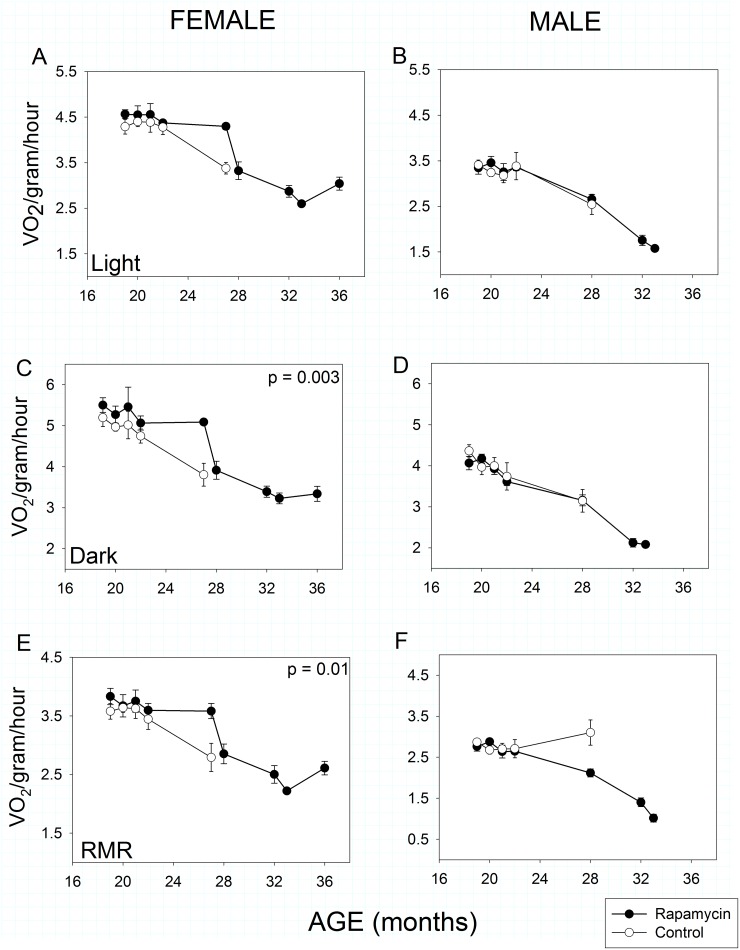
Fig 3. Metabolic activity in rapamycin-fed mice (filled circles) compared to controls (hollow circles).
P-values shown on individual panels only if there is a significant treatment effect independent of age. Sample sizes varied, depending on age, control females, n = 8–4; rapamycin females, n = 11–3; control males, n = 9–5; rapamycin males, n = 16–2. A, B: Mass-specific metabolic rate during the light (= inactive) phase. Males and females showed no effects of rapamycin treatment on mass-specific metabolic rate during the inactive phase of their daily 24-hour cycle, although both sexes showed highly significant (p << 0.001) sex x age treatment effects. C, D: Mass-specific metabolic rate during the dark (= active) phase. Aging rapamycin-fed females, but not males, maintained significantly higher metabolic rates between measures taken at 24 and 28 months of age compared to controls during the dark (= active) phase of the 24-hour light cycle. Both males and females showed highly significant (p <<0.001) decline dark-phase metabolic rate with age irrespective of treatment. E, F: Resting mass-specific metabolic rate. Resting metabolic rate declined with age in females, but aging rapamycin-fed females had higher resting metabolic rates compared to age-matched controls. Resting metabolic rate declined significantly in aging rapamycin-fed males but not in age-matched controls (treatment x age, p << 0.001).

