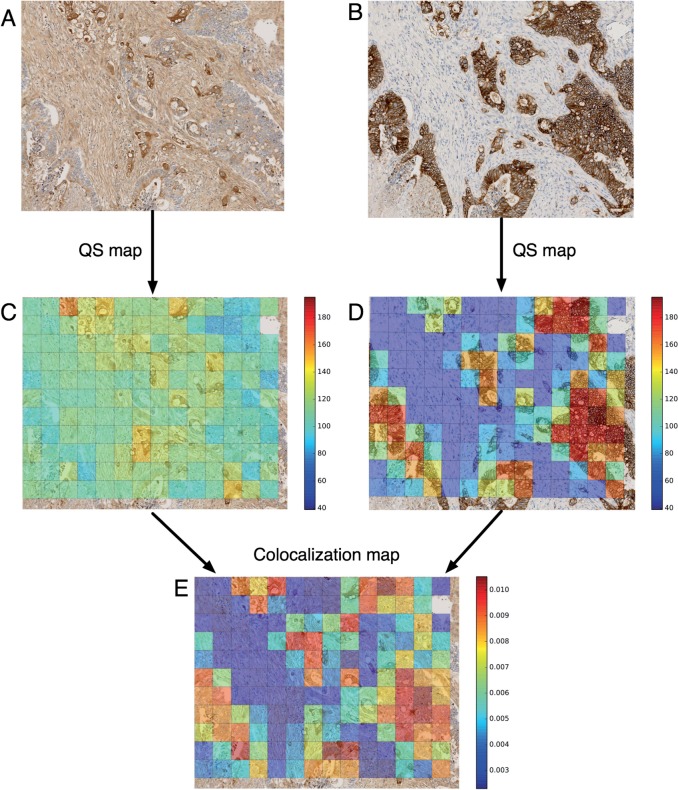
Figure 6:
Example of colocalization index map computation at high resolution. (A) FHL-2 high FOV (20 × magnification). (B) Corresponding (ie, result of the low-resolution registration step) E-cadherin FOV (20 × magnification), which provides a good starting point for the high-resolution registration. (C and D) Usual staining measurements, such as the Quick-Score (ie, mean DAB intensity) as illustrated here, are computed on each tile. FOV A is divided into squared tiles 80 μm in length, and the high-resolution transform is then used to compute the corresponding tiles in FOV B (note the slight rotation of the tiles). The RMSE-R after the high-resolution registration for this pair of FOVs was 17 μm. (E) The local contributions to a global colocalization index, such as the overlap coefficient as illustrated here, are computed on each tile. The value of the global overlap index (which is the sum of the tile contributions and takes values between 0 and 1) is 0.8784 for the two FOVs. FOV, field of view; RMSE, root mean square error.

