
Figure 4:
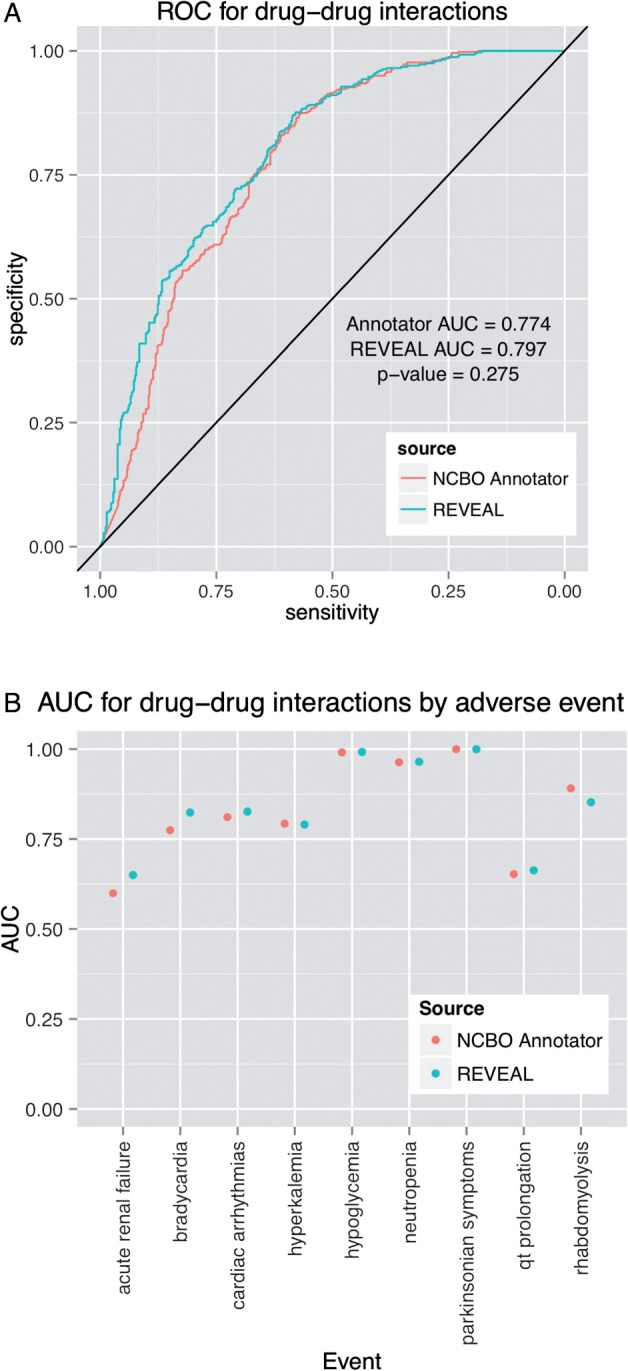
Detection of adverse drug–drug interactions. The analysis of Iyer et al.7 was carried out using either the NCBO Annotator-based workflow or REVEAL to process clinical notes from the Stanford Translational Research Integrated Database Environment (STRIDE). (A) There is no significant difference in the receiver-operator characteristic (ROC) curves (p = 0.275 by DeLong's test) for the two systems. (B) Area under the ROC curves (AUC) for each of nine adverse events separately. There is no significant difference in performance for any adverse event (p>0.05).