
Figure 2.
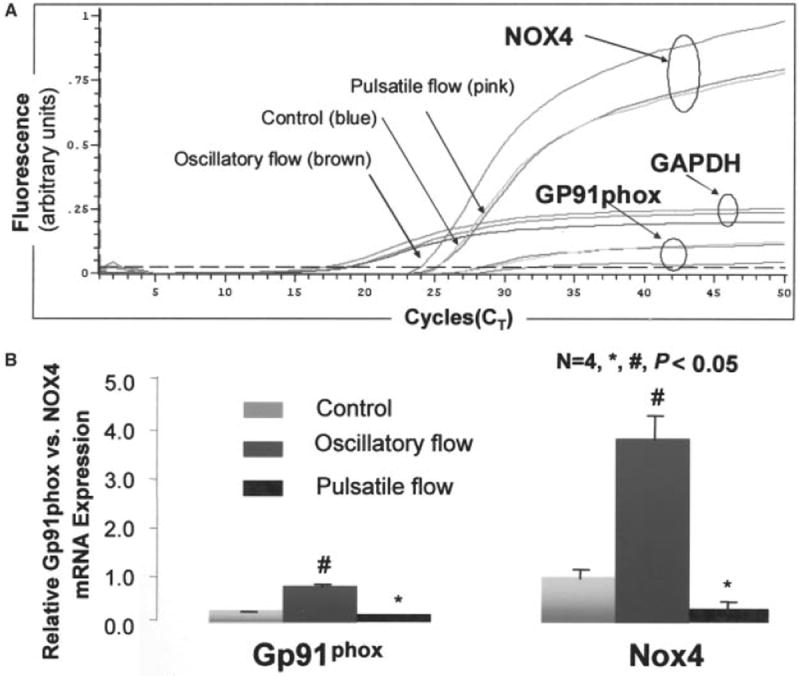
A, Fluorescence signal versus cycle number for Nox4 and gp91phox and GAPDH. B, Bar graphs show relative mRNA expression for gp91phox and Nox4 in response to pulsatile versus oscillatory flow conditions. Values are expressed as mean±SEM. #P<0.05 gp91phox vs control; *P<0.05 Nox4 vs control.