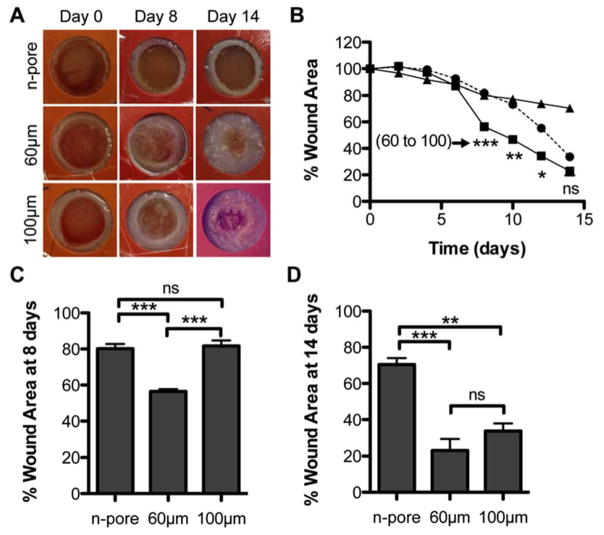
Figure 3.
(A) Representative images of hydrogel treated wounds over the course of the study. Wound area was manually measured (n = 4 – 5) and reported as a percentage with respect to the wound area at t = 0 (B, triangles = n-pore, squares = 60 μm, circles = 100 μm porous hydrogels). Wound closure measurements of wounds with pDNA loaded hydrogels showed significant differences between porous and n-pore hydrogels. Direct comparison of wound closure at day 8 (C) and 14 (D). Times correspond to initial onset of closure and end of study, respectively.

