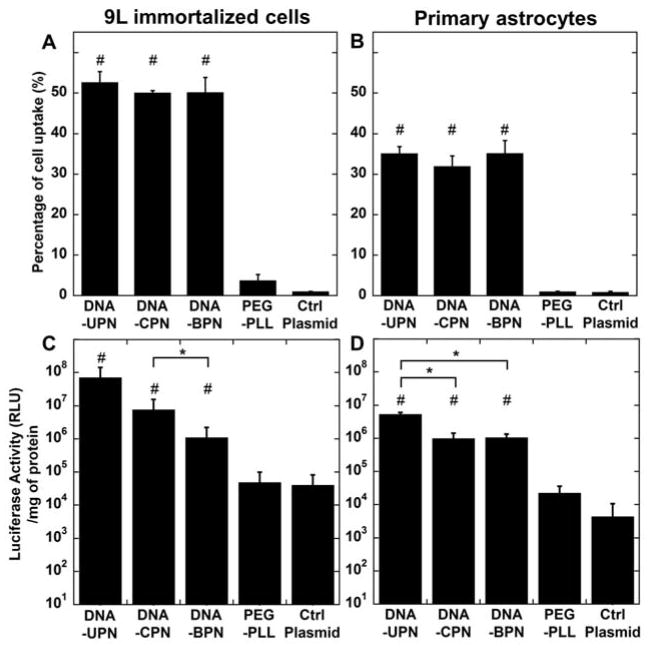
Figure 3. Cellular uptake and in vitro transfection.
Flow cytometric analysis of in vitro gene vector cell uptake in (A) 9L gliosarcoma cells and (B) primary astrocytes following treatment with fluorescently tagged gene vectors. In vitro transfection of luciferase gene to (C) 9L gliosarcoma cells and (D) primary astrocytes by cationic polymer-based gene vectors. Data represented as mean ± SEM. *Denotes statistical significant difference (p < 0.05) between PEI-based gene vectors and #denotes statistically significant difference from free plasmid control (p <0.05).

