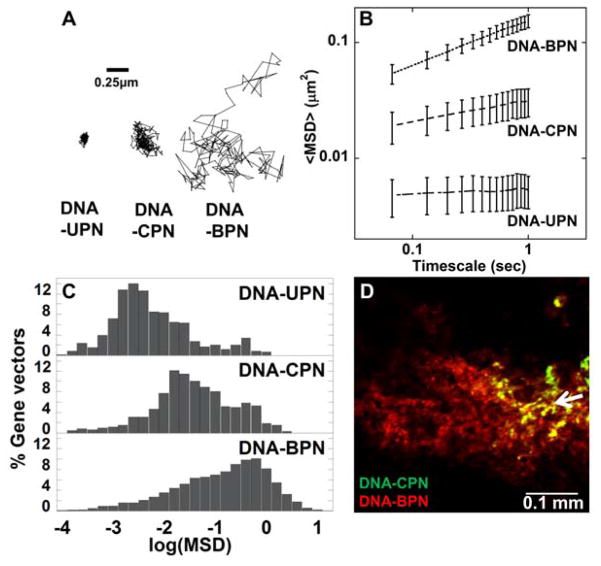
Figure 4. Penetration of gene vectors through rodent brain tissue.
(A) Representative particle trajectories over 20 s in ex vivo rodent brain tissue. Trajectories shown are of particles that had an MSD equal to the ensemble average at a time scale of 1 s. Scale bar = 0.25 μm (B) Ensemble-averaged geometric mean of MSD of PEI-based gene vectors as a function of time. Data represent the ensemble average of at least three independent experiments, with n ≥ 500 particles tracked for each experiment. (C) Histograms of individual MSD of respective gene vectors from at least three independent experiments at a timescale of τ = 1 s. (D) In vivo spread of Cy5- labeled DNA-CPN (Green) and Cy3-labeled DNA-BPN (Red) following bolus co-injection in the striatum. Scale bar = 100 μm. Co-localization of DNA-BPN and DNA-CPN in each image is represented as yellow. White arrow demonstrates point of injection.

