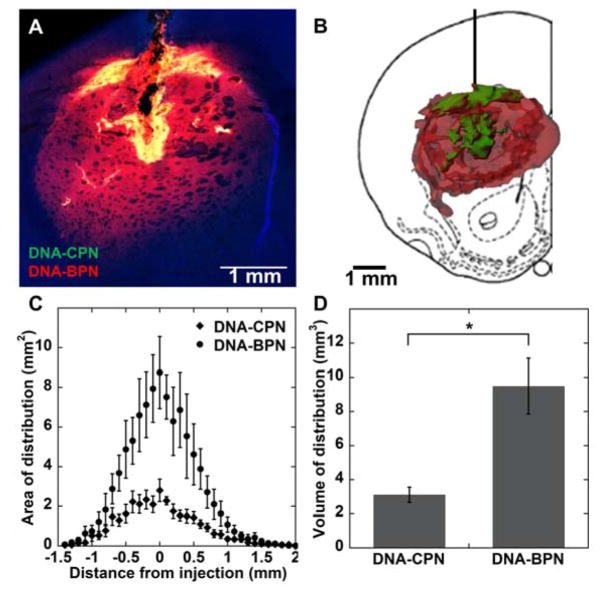
Figure 5. In vivo distribution of PEI-based gene vectors following CED.
(A) Representative distribution of labeled Cy3 DNA-CPN (green) and Cy5 DNA-BPN (red) in rat striatum using confocal microscopy; DAPI staining for cell nuclei (blue). Colocalization of DNA-BPN and DNA-CPN in each image represented as yellow. Scale bar = 1 mm. (B) Representative 3D reconstruction of labeled Cy3 DNA-CPN (green) and Cy5 DNA-BPN (red) distribution in the rat striatum following CED. (C) Image-based MATLAB quantification of area of distribution of PEI-based NP as a function of distance from the injection site (n = 6). (D) Summated image-based MATLAB quantification of volume of distribution for DNA-BPN and DNA-CPN (n = 6). *Denotes statistical significant difference (p < 0.05).

