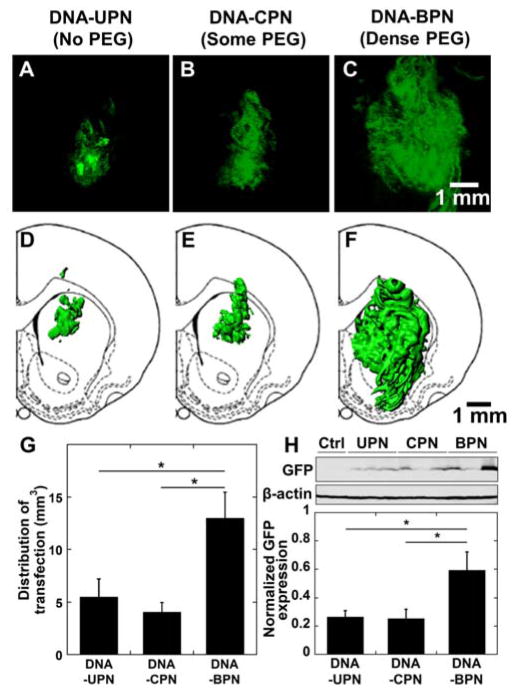
Figure 6. In vivo distribution and overall level of eGFP transgene expression following CED of various PEI-based gene vectors carrying eGFP plasmid DNA.
(A–C) Representative stacked and aligned confocal images of eGFP expression (Green) following administration of the respective PEI-based gene vectors in the rodent caudate putamen. Scale bar = 1 mm. (D–F) Isosurface 3D reconstruction of distribution of in vivo eGFP expression using multiple sequential confocal fluorescence images of respective PEI-based gene vectors. (G) Image-based MATLAB quantification of volume of distribution of eGFP expression (n = 4–6). (H) Transgene expression following NP CED administration in rodent striatum. eGFP expression was analyzed using Western blot. The band quantification was performed using Multi Gauge software (Fujifilm). The expression level of eGFP was normalized with β-actin. Data represents the mean ± SEM. *Denotes statistically significant difference (p < 0.05).

