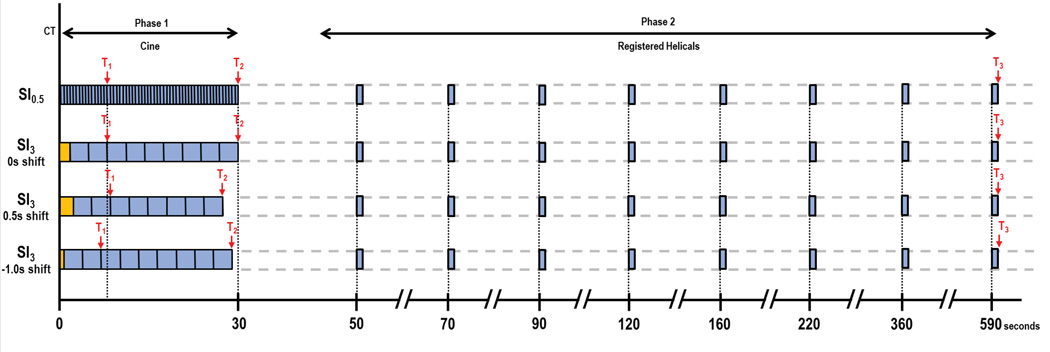
| Top row: |
Reference dataset (SI0.5). 0.5s sampling interval in Phase 1, combined with 8 anatomically registered Phase 2 images. T1, pre-enhancement set-point; T2, Post-enhancement set-point; T3, last second phase set-point. |
| Second row: |
Subsampled dataset, T1=t0. Orange block, baseline data-points added to ensure comparability of baseline values across all sampling intervals. |
| Third row: |
Subsampled dataset. Sampling interval same as second row, but T1=shifted forward. |
| Bottom row: |
Subsampled dataset. Sampling interval same as second row, but T1=shifted backward |

