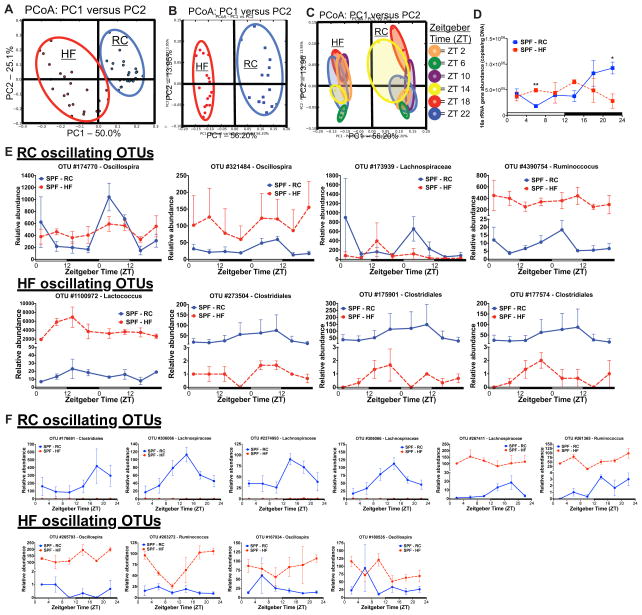
Figure 2. Diurnal gut microbe community structure is altered by high fat feeding.
Principal Coordinate Analysis (PCoA) of weighted UniFrac distances from 16S rRNA amplicon sequences colored by diet in fecal pellets (A) collected via repeat sampling over 48h (n=3 mice/treatment) and in cecal contents (B) collected over 24h (n=2–3 mice/time point) from SPF C57Bl/6 mice fed HF or RC. (C) PCoA analysis of cecal contents colored by Zeitgeber (ZT) time (PC=principle coordinate). (D) 16S rRNA abundance determined via qPCR using universal primers in cecal contents. Data represent mean ± s.e.m. **p<0.01; *p<0.05 via unpaired t-test at each time point. (E) Relative abundance of oscillating 16S rRNA OTUs determined via eJTK_CYCLE in fecal samples collected every 6h over 48h and in cecal contents (F) collected every 4h over 24h at sacrifice. Data represent mean ± s.e.m. See also Figure S2A–E, Table S3 and S5.

