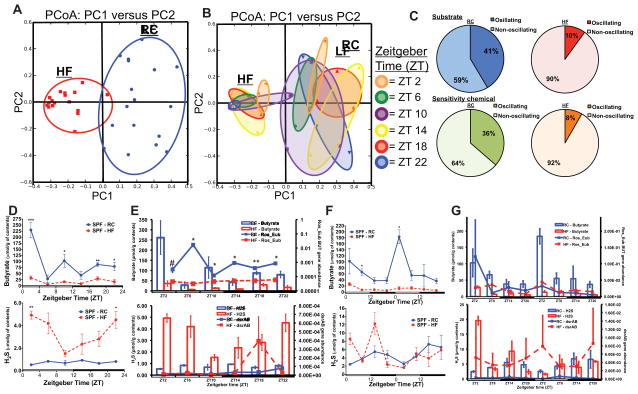
Figure 3. High fat diet shifts diurnal microbial function and metabolite production.
Principle Coordinate Analysis (PCoA) of Biolog™ spectrophotometric analysis of cecal contents from mice fed RC and HF incubated anaerobically and colored by diet (A) and Zeitgeber (ZT) time (B). Percent oscillating vs. non-oscillating substrate and sensitivity chemicals in fecal pellets (C) from HF or RC collected over 48h (n=3/time point). Diurnal cecal butyrate concentration (D, top) and H2S production (bottom) in cecal contents collected from RC or HF (expressed as μmol/g of content) (n=2–3/time point). Data represents mean ± s.e.m. *p<0.05,**p<0.01 determined via unpaired t-test at each time point. (E) Rosburia butyryl-CoA: acetate CoA-transferase (BUT Ros_Eub, top) and dissimilatory sulfite reductase (dsrAB, bottom) gene abundance (right axis, normalized to 16S abundance) in cecal contents from mice fed RC or HF. Butyrate and H2S concentration are presented on the left axis. (F) Fecal butyrate concentration (top) and H2S production (bottom) collected via repeat sampling over 48h from mice fed RC and HF (expressed as μmol/g of content) (n=3/time point. (G) BUT Ros_Eub (top) and dsrAB (bottom) gene abundance (right axis, normalized to 16S abundance) in fecal pellets over 48h. Data represents mean ± s.e.m. #p<0.1, *p<0.05, **p<0.01 determined via unpaired t-test at each time point. See also Figure S3A–D, Table S4 and S5.

