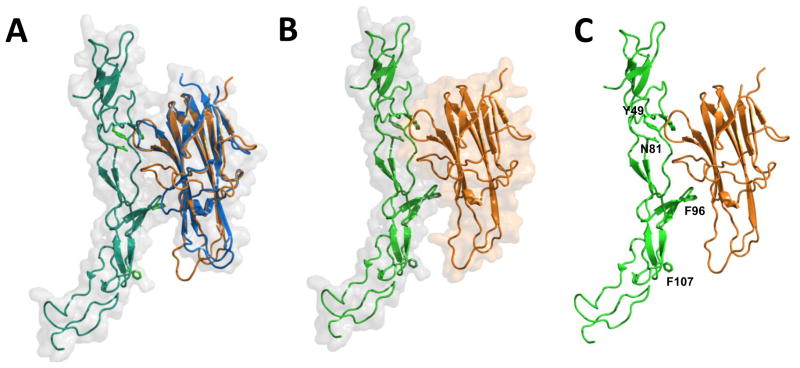
Figure 1. Structure model of OPG-TRAIL complex.
Superposition of human TRAIL (orange) with human RANKL (blue)-OPG (green) complex using a RANKL monomer as a reference (A); Surface diagram of TRAIL (orange) and OPG (green) (B); and, putative OPG residues (in green) interacting with TRAIL (C) are shown. Designated amino acid residues (Y49, N81, F96, and F107) were subjected to site-directed mutagenesis. Ribbon and surface diagrams were created with the PyMol program.

