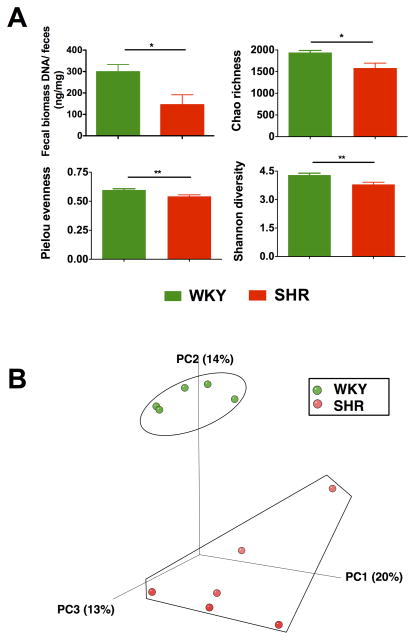
Figure 1. Gut microbiota communities in WKY rats and SHR.
A. Decreased micro-ecological parameters of the gut. Fecal samples were collected from WKY (n=5) and SHR (n=6) rats and bacterial 16S ribosomal DNA were amplified and sequenced to analyze the compositions of microbial communities. Fecal biomass and microbial richness, evenness, and diversity of WKY and SHR were evaluated. B. Principal coordinate analysis of WKY and SHR. Weighted uniFrac analyses were used to calculate the distances between fecal samples from WKY and SHR. Each axis percentage describes how much variation that one dimension accounts for. Darker colored circles indicate a point closer to the reader, while lighter colored circles indicate a point further away. By comparing the samples in a 3 dimensional figure, a clear separation was observed between the two clusters, representing WKY and SHR rats, respectively. Results were compared by student’s t-test; * p<0.05; **p<0.01.

