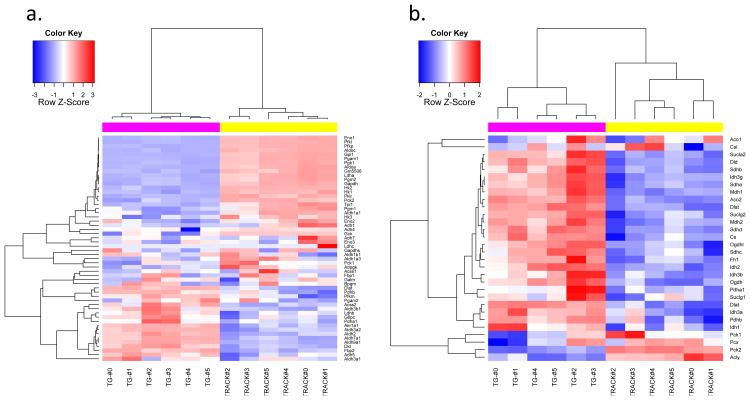
Figure 3. Heatmaps of transcripts encoded by genes involved in glycolysis and the TCA cycle, TRACK+/TG-.
Heatmaps of genes involved in glycolysis (a) and the TCA cycle (b). Log2 transformed RPKM values of 61 and 31 genes involved in glycolysis and TCA cycle pathways were used to create these heatmaps. The animal identity is indicated by the colored rows on top of the heatmap matrix. The magenta color indicates TRACK TG+ mice. The yellow color indicates TRACK TG- mice. The blue color in the heatmap matrix indicates relatively decreased transcript levels and the red color indicates relatively increased transcript levels compared to the mean transcript level for each gene. Brighter blue or red color indicates a greater fold change. The glycolysis genes listed in Figure 2 show increased transcript levels in the TRACK TG+ kidneys (red color) compared to TG- kidneys (a). The TCA cycle genes generally show decreased transcript levels in the TRACK TG+ kidneys (blue colored) compared to TG- kidneys (b).

