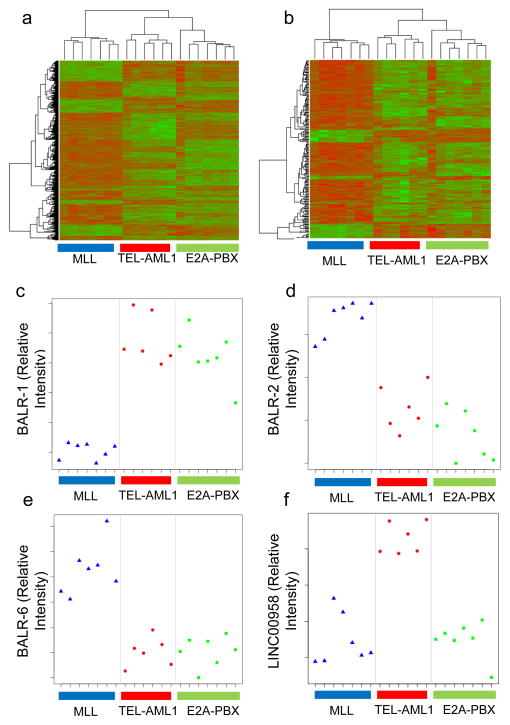
Figure 1. LncRNA expression segregates with ALL cytogenetic subtypes.
(A) Hierarchical clustering of differentially regulated protein-coding gene expression data (adjusted p-value after correction for multiple hypothesis testing, p-adj<0.01) in 20 B-ALL samples with three common translocations, namely, t(12; 21), TEL-AML1(n=6); t(1;19) E2A-PBX (n=7); and t(4;11) MLL-AF4 (n=7). Genes that are relatively upregulated appear in green, and those that are relatively downregulated appear in red. (B) Hierarchical clustering of lncRNAs that were differentially expressed (adj. p-value<0.01) showed distinct separation into three subsets of B-ALL, corresponding to the cytogenetic abnormalities. (C–F) Plots of normalized intensity ratios of BALR-1, BALR-2, BALR-6, and LINC00958 in individual cases of B-ALL, respectively.

