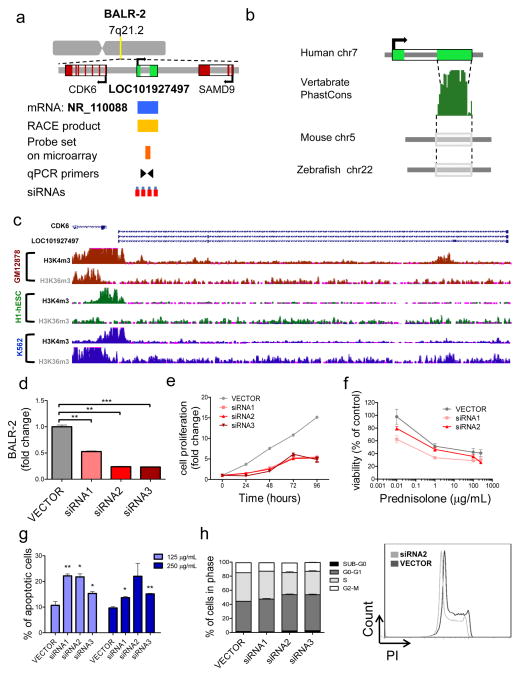
Figure 4. BALR-2 shows a functional role in human B-ALL cell lines.
(A) Map showing the position of BALR-2 in the genome, including the locations of neighboring genes, corresponding annotated mRNA, RACE product confirmation, probe set on microarray, qPCR primers and siRNAs targeting the lncRNA. (B) The Vertebrate PhastCons plot from the UCSC whole-genome alignments to mouse and zebrafish shows conserved regions within the terminal exon, including a region highly conserved among 91 vertebrates. (C) Chip-seq histone modification map from the ENCODE/Broad institute, taken from UCSC genome browser, shows H3K4m3 and H3K36m3 pattern at the BALR-2 locus in three different cell types indicating active promoter and transcription of the lincRNA (D) siRNA-mediated knockdown of BALR-2 in RS4;11 cell line, shown by RT-qPCR (normalized to ACTIN). (E) Reduction of cell proliferation in RS;411 cells stably transduced with siRNAs against BALIR-2, measured by MTS assay. Absorbance was normalized to the 0 hour time point (p-value < 0.05 for all non-zero hour time points). (F) In vitro prednisolone response curves for RS4;11 cell lines transduced with vector control, siRNA1 and siRNA2. Prednisolone response was assessed by MTS assay after 24 hours of plating. Untreated samples were set to 100%. Absorbance readings were normalized to untreated samples. (G) Increased apoptosis measured by AnnexinV staining. RS4;11 cells stably transduced with siRNAs against BALR-2 were treated with 125 μg/mL, and 250 μg/mL prednisolone for 24 hours. (H) Propidium iodide staining of RS4;11 cells treated with siRNAs, showed an increase in G0-G1 cells (p-value < 0.05 for all siRNAs), as well as a decrease in S cells (p-value < 0.05 for all siRNAs), and G2-M cells (p-value <0.05 for siRNAs1-3) The right hand panel shows a representative histogram of propidium iodide staining. Comparisons made using a two-tailed T-test, p<0.05 (*); p<0.005 (**); p<0.0005 (***).

