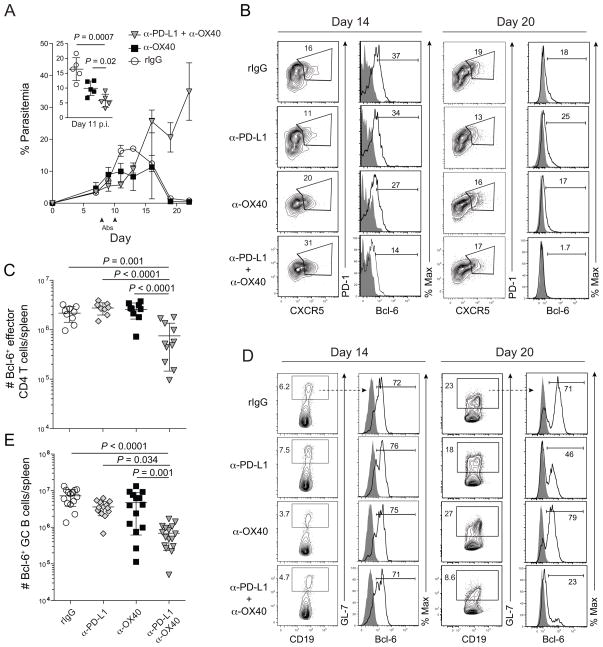
Figure 5. Coordinate α-OX40 ligation and PD-1 blockade during experimental malaria abrogates T follicular helper and germinal center B cell responses.
(A–E) Mice were infected with 106 P. yoelii-infected RBCs and treated with rat IgG, α-PD-L1, α-OX40, or α-PD-L1 and α-OX40 on days 7 and 10 p.i. (A) Parasitemia kinetics (n=5 mice/group). Data (mean ± SEM) in (A) are representative of 5 independent experiments. (B) Representative dot plots showing PD1+CXCR5+ Tfh cells and histograms showing Bcl-6 expression on days 14 (left) and 20 (right) p.i. (C) Cumulative data (mean ± SD) showing the total number of Bcl-6+ effector CD4 T cells on day 20 p.i. pooled from 2 independent experiments. (D) Representative dot plots showing CD19+GL-7+ B cells and histograms showing Bcl-6 expression on days 14 (left) and 20 (right) p.i. (E) Cumulative data (mean ± SD) showing the total number of Bcl-6+CD19+GL-7+ B cells on 20 p.i. pooled from 3 independent experiments were analyzed using one-way ANOVA while correcting for multiple comparisons via the Tukey method. Data in (B–E) are representative of 3 independent experiments. Symbols in (C,E) represent individual mice. See also Figure S5.

