
Figure 3.
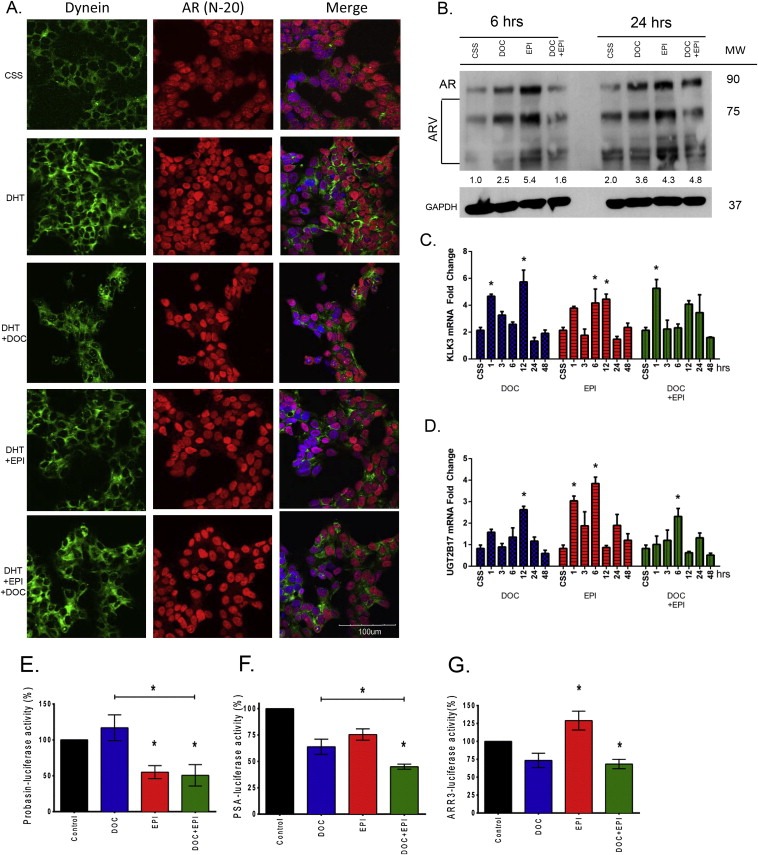
Effect of targeting microtubules and N‐terminal AR on cytosolic protein association and nuclear localization/activity in 22Rv1 prostate cancer cells. Panel A, Confocal image analysis of dynein IC ½ expression and localization in 22Rv1 prostate cancer cells. Cells were exposed to DOC, EPI (as single agents), or in combination (4 h) and were subsequently treated with DHT (1 nM) for 1hr. Cytoplasmic localization of dynein and AR expression were detected using the respective antibodies and serial images are shown. Magnification 200×. Panel B, reveals Western blot of AR protein expression profile in 22Rv1 cells after treatment with DOC, EPI or combination, for 6 and 24 h. Control cells, exposed to CSS medium. GAPDH was used as a loading control. MW of the full length AR and the variants are shown on left and densitometry of full length AR indicated below blot. Panels C and D, reveal the RT‐PCR analysis of PSA/KLK3 mRNA expression (FL‐AR target gene) and UGT2B17 mRNA expression (AR V7 target gene) respectively in 22Rv1 human prostate cancer cells in response to treatments. Numerical values are the mean of three measurements for a single gene performed in triplicate ± SEM. Panels E, F and G, indicate the results for the transcriptional reporter assays in 22Rv1 cells. Cells were transiently transfected with PB‐luciferase (E), PSA (6.1 kb)‐luciferase (F), or ARR3‐Luc reporters (G) and pre‐treated with EPI, DOC, or combination (EPI + DOC) prior to incubation with R1881. Luciferase activity is represented as percentage of vehicle control activity in response to androgen. Bars represent SEM of three independent experiments.