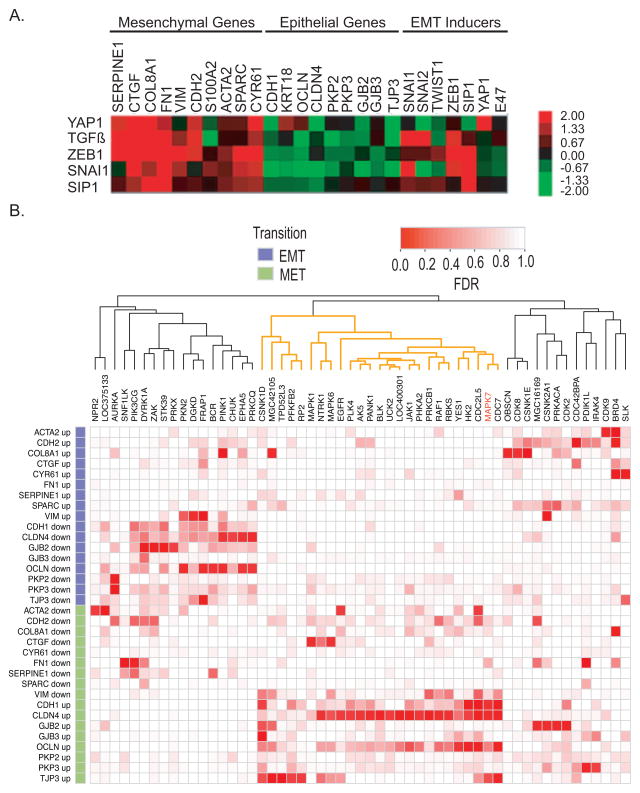
Figure 1. Validation of shRNA kinome screen.
(A) Relative expression levels of EMT signature in response to EMT inducers: YAP1, TGF-β, Zeb1, Snai1 and SIP1 in MCF10A:Myc cells.
(B) Heat map analysis of the arrayed kinome shRNA screening using the EMT gene-set signature. Each row corresponds to a gene and a direction (EMT or MET). Each column corresponds to a gene that was knocked down. Red corresponds to a low False Discovery Rate (FDR) and white to a high FDR using midRSA methodology. RNAi for 752 genes was administered, but only the genes with FDR < 25% for at least one marker and direction are included in the matrix. The columns of the matrix were clustered based on correlation of the FDR values. For details, please see supplemental methods.

