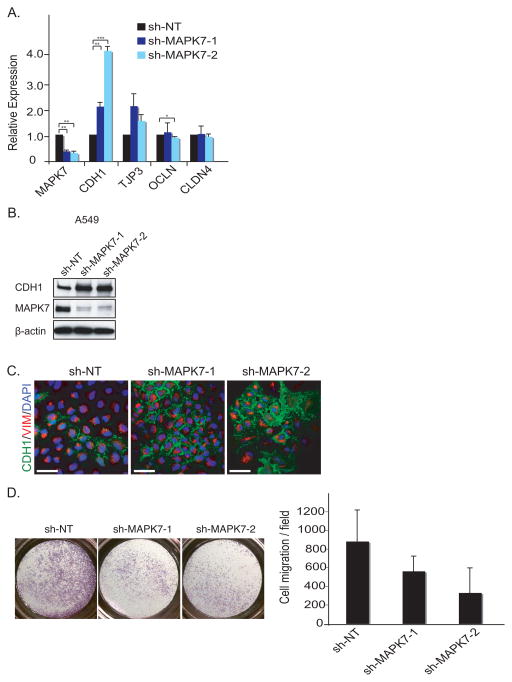
Figure 2. Knockdown of MAPK7 induces Mesenchymal-Epithelial Transition (MET).
(A) MET is shown by qRT-PCR upon knockdown of shRNA against non-target (sh-NT) and two independent shRNAs against MAPK7 (sh-MAPK7-1 and sh-MAPK7-2) in A549 cells. Error bars represent SD from three individual experiments. * represents p-value < .05, ** represents p-value < .01 and *** represents p-value < .001.
(B) Knockdown of MAPK7 induces MET. Knockdown of MAPK7 in A549 cells increase CDH1 expression as demonstrated by immunoblot analysis. β-actin is used as loading control.
(C) Knockdown of MAPK7 induces CDH1 expression in A549 cells, demonstrated by immunofluorescence staining. Green = CDH1, red = VIM (Vimentin) and blue = dapi. Scale bar (white) = 50 μm.
(D) Knockdown of MAPK7 in A549 cells reduces cell migration as assayed using a Boyden Chamber. Quantitation of cell migration is derived from five independent fields. Error bars represent SD from three independent experiments.

