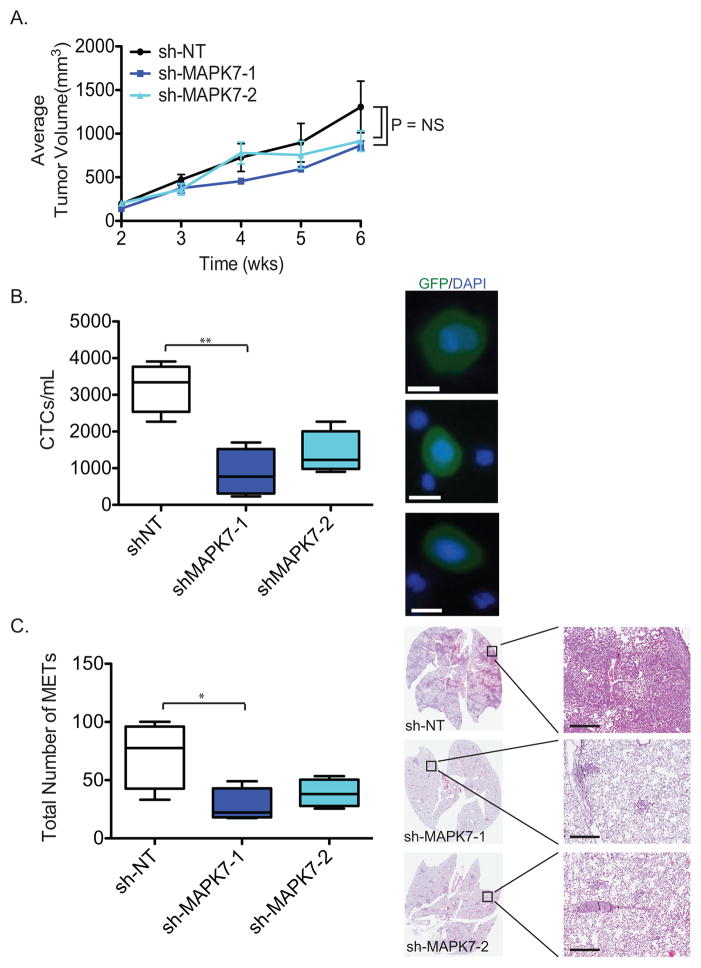
Figure 4. Knockdown of MAPK7 decreases circulating tumor cells (CTCs) and lung metastasis.
(A) Knockdown of MAPK7 in MDA-MB-231 (4175 TGL variant) cells does not affect tumor volume in mice. Quantitation of tumor volume (mm3) is shown. Tumor volume data are represented as the mean of 4 tumors in 4 mice for each group (+/− SEM).
(B) Quantitation of GFP+ CTCs from mice bearing sh-MAPK7-1 (N=4) and sh-MAPK7-2 (N=4) knockdown compared to control sh-NT (N=4) in MDA-MB-231 (4175 TGL) cells. Error bars represent SEM. * represents p-value < .05, ** represents p-value < .01 and *** represents p-value < .001. Representative images of CTCs are shown (blue = dapi, green = GFP). Scale bar (white) = 10 μm.
(C) Quantitation of total number of lung metastases (METs) stained by H&E from mice (N=4 for sh-NT, sh-MAPK7-1 and sh-MAPK7-2) bearing primary tumors with either sh-MAPK7-1 or sh-MAPK7-2 knockdown, compared to control in MDA-MB-231 (4175 TGL) cells. Lung metastasis as depicted by H&E staining was enumerated based on number of lung lesions regardless of size. Five step sections (50 microns each) were subjected to H&E staining in order to quantify the number of lung metastatic lesions. Error bars represent SEM. * represents p-value < .05. Representative images of H&E-stained lung metastases are shown from mice for sh-NT, sh-MAPK7-1 or sh-MAPK7-2. Scale bar (black) = 300 μm.

