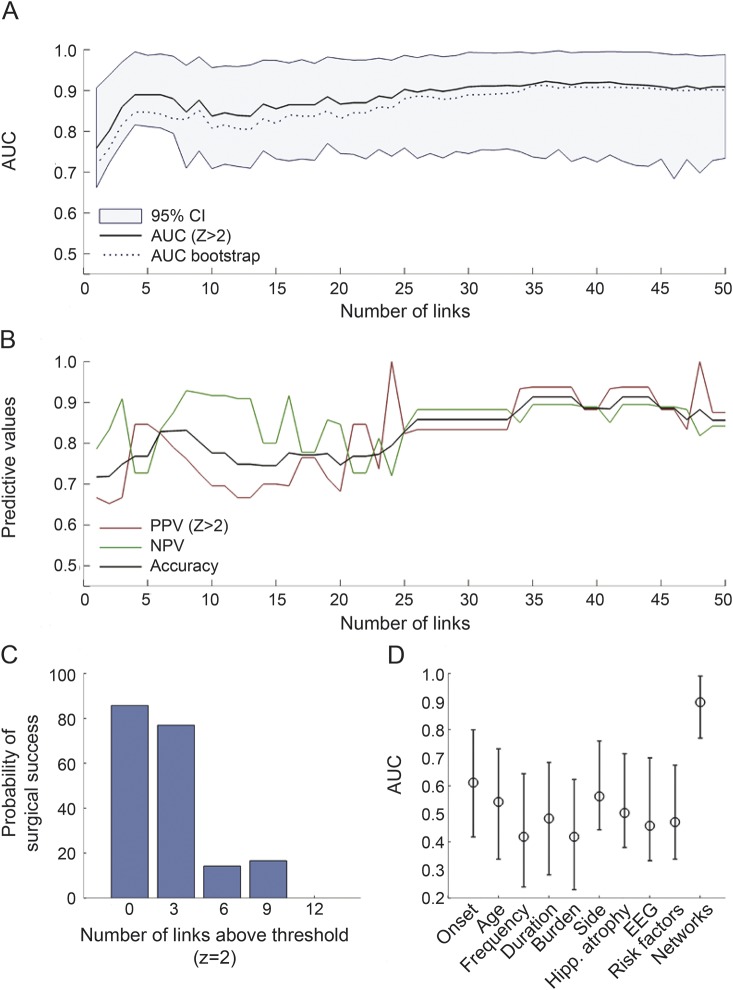
Figure 2. Results from the model constructed from individual connectome data.
(A) The range of areas under the curve (AUCs) (y-axis) obtained from the model constructed from a subnetwork involving an ascending number of links (x-axis). The shaded area demonstrates the 95% confidence interval (CI) when resampling the linkwise data. (B) Corresponding predictive values. (C) The probability of surgical success as a function of the number of links above the critical Z threshold (Z = 2), when a subnetwork composed of 30 links is assessed. (D) The AUC obtained from the networks model (also including 30 links), in comparison with the AUCs from clinical variables. The error bars represent the AUCs obtained from bootstrapping. NPV = negative predictive value; PPV = positive predictive value.

