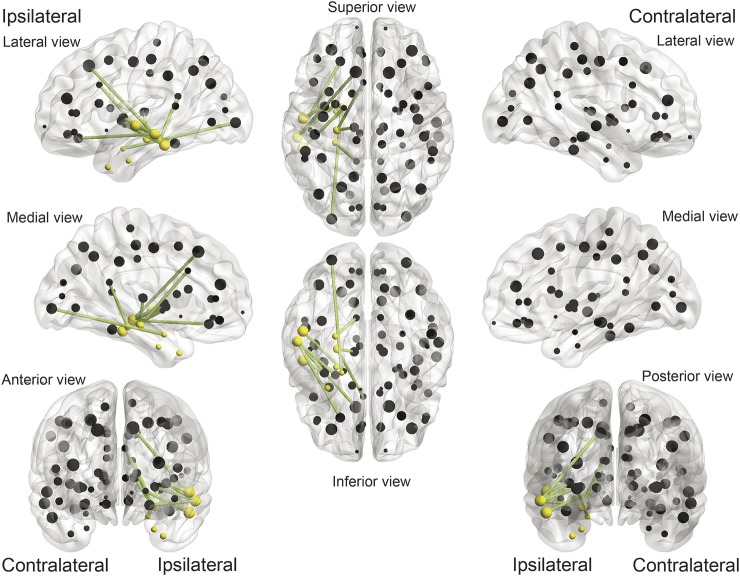
Figure 3. Connectome links were more commonly associated with surgical outcome, taking into account individual topographical variability.
Connectome links that were repeatedly chosen by the cross-validation model (in green), in relationship with cortical regions of interest (ROIs) (represented by spheres located in the ROI center of mass). Spheres in yellow represent the 8 ROIs defined as pertaining to the temporal region. The links in this figure correspond to the links outlined in table 1. In general, patients who exhibited a cumulative number of weights Z >2 among these links were less likely to become seizure-free after surgery.

