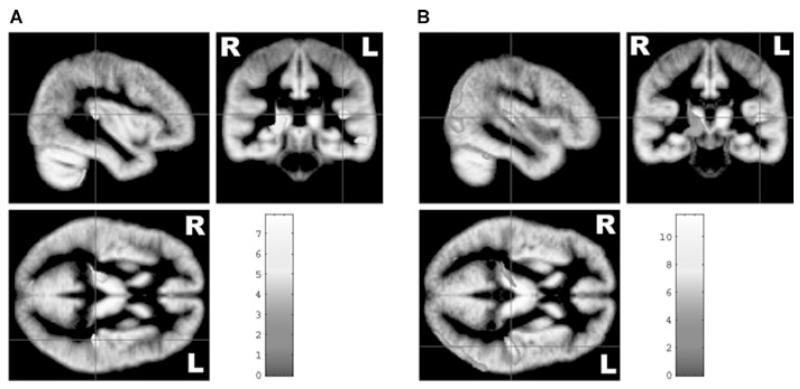
Fig 1.
Statistical parametric maps showing leftward PT asymmetry for subjects with (A) left- as well as those with (B) right-hemisphere language dominance. Structural differences are superimposed on the study-specific symmetrical gray matter template. Color scales bars indicate the T score. Please note that all results are presented in radiological convention (left = right).

