. 2015 May 13;9(3):034103. doi: 10.1063/1.4921252

FIG. 2.

FIG. 2.

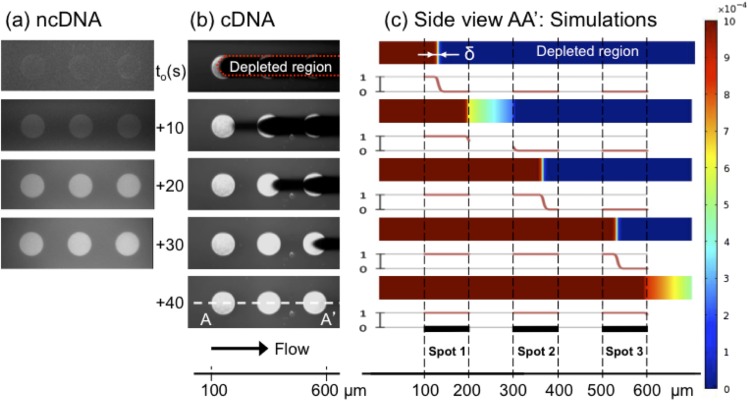
Fluorescence snapshots (top view) of a bio-functionalized nanoslit (h = 600 nm) exposed to 1 μM non-complementary (nc) and complementary DNA (cDNA) solutions in (a) and (b), respectively, for breast cancer BRAC1 gene detection. (a) The introduction of dye-labeled ncDNA does not bind to the probe DNA but increase the background in a uniform way due to non-specific adsorption. However, the depletion zone in (b), but not in (a), is characteristic to ∼100% reaction efficiency in the device. (c) The corresponding simulations along the A-A′ line (side view) in (b) truthfully reproduce the experimental results: concentration of target molecules in the channel (color map) and normalized rate of hybridized targets (red curve). The depleted layer δ can clearly be seen in the thickness of the nanoslit. The color bar is in units of 1 mM. (Multimedia view) [URL: http://dx.doi.org/10.1063/1.4921252.1]Download video file (1.8MB, avi) DOI: 10.1063/1.4921252.1 [URL: http://dx.doi.org/10.1063/1.4921252.2] Download video file (2.6MB, avi) DOI: 10.1063/1.4921252.2 [URL: http://dx.doi.org/10.1063/1.4921252.3] Download video file (1.8MB, avi) DOI: 10.1063/1.4921252.3